Compensation growth in Los Angeles outpaces U.S. average in new 2025 data
Wage and compensation growth in Los Angeles outpaced the national average in the year ending March 2025, according to new data from the U.S. Bureau of Labor Statistics. While growth has slowed slightly year-over-year, LA remains a top-tier metro for rising private sector pay.

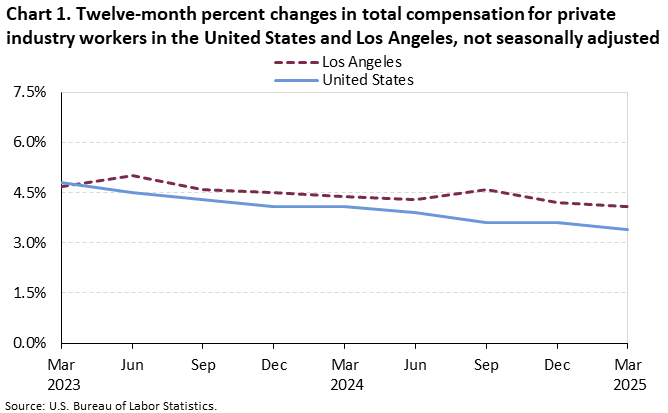
New data from the U.S. Bureau of Labor Statistics (BLS) reveals that compensation growth for private industry workers in the Los Angeles-Long Beach metropolitan area continues to outpace the national average.
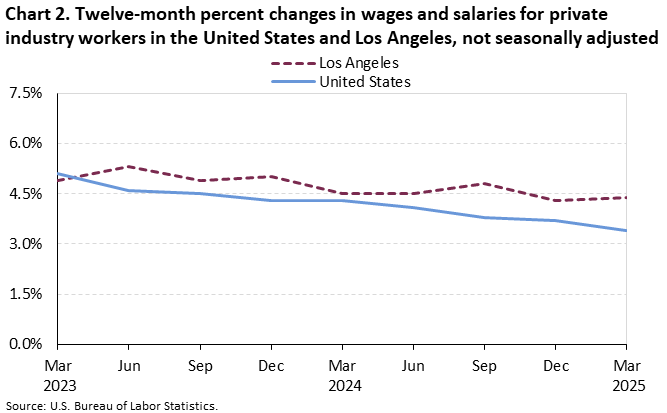
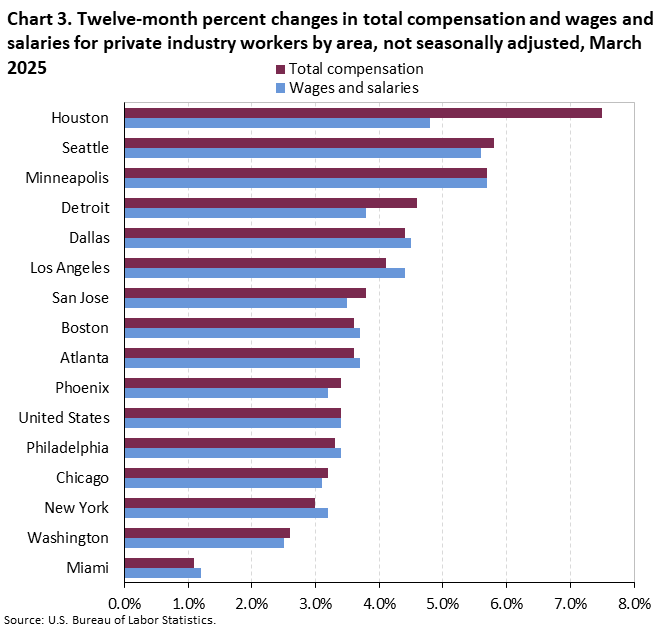
For the 12-month period ending March 2025, Los Angeles saw a 4.1% increase in total compensation, compared to 3.4% nationally. Wages and salaries alone rose by 4.4% in LA—again outpacing the national gain of 3.4%.
A Steady Performer in the West
Los Angeles ranked in the middle of the pack among the four largest metro areas in the West. Here's how it compares for the year ending March 2025:
- Total Compensation Growth:
- Seattle: 5.8%
- Los Angeles: 4.1%
- San Jose: 3.8%
- Phoenix: 3.4%
- Wage and Salary Growth:
- Seattle: 5.6%
- Los Angeles: 4.4%
- San Jose: 3.5%
- Phoenix: 3.2%
National Perspective: LA in the Top Half
In a comparison of the 15 largest U.S. metro areas, Los Angeles ranks:
- 6th in total compensation growth
- 6th in wage and salary growth
By contrast, Houston leads all metro areas with a massive 7.5% gain in total compensation, while Minneapolis-St. Paul saw the largest increase in wages and salaries at 5.7%. At the bottom of the rankings, Miami-Fort Lauderdale-Port St. Lucie saw just a 1.1% increase in compensation and a 1.2% rise in wages.
Long-Term Trends Show Gradual Slowdown
Though LA remains a consistent outperformer, both local and national compensation growth have moderated over time. In 2022, LA’s compensation growth exceeded 5%, but has cooled to 4.1% by March 2025. Nationally, the same trend is apparent—dropping from 5.1% in early 2022 to 3.4% today.
What's Next?
The BLS plans to enhance data precision beginning July 2025 by publishing Employment Cost Index levels to three decimal places. This change will allow for even more accurate analysis in future reports.
Related