Overview
California’s per capita personal income has steadily risen for nearly a century—shaped by economic booms, recessions, and major policy shifts. This page offers a continuously updated view of the state’s income growth using live federal data, alongside recent revisions to official estimates.
Use the interactive tools below to explore how California’s income has changed over time and how new data releases may adjust past figures.
Historical Growth: 1930 to Present
The chart below tracks California’s per capita personal income since 1930. Income levels remained modest through the early 20th century, but starting in the 1980s, the pace of growth accelerated. That trend has continued through the 2000s, with sharp gains following the COVID-19 pandemic and subsequent economic recovery.
Interactive Chart:
This visualization updates automatically when the U.S. Bureau of Economic Analysis releases new figures.
Data Revisions: Comparing Estimates Over Time
Economic data is often revised after its initial release to reflect more complete information. The chart below compares two recent vintages of California’s per capita income estimates—from February and March 2025—covering the years 2020 through 2024.
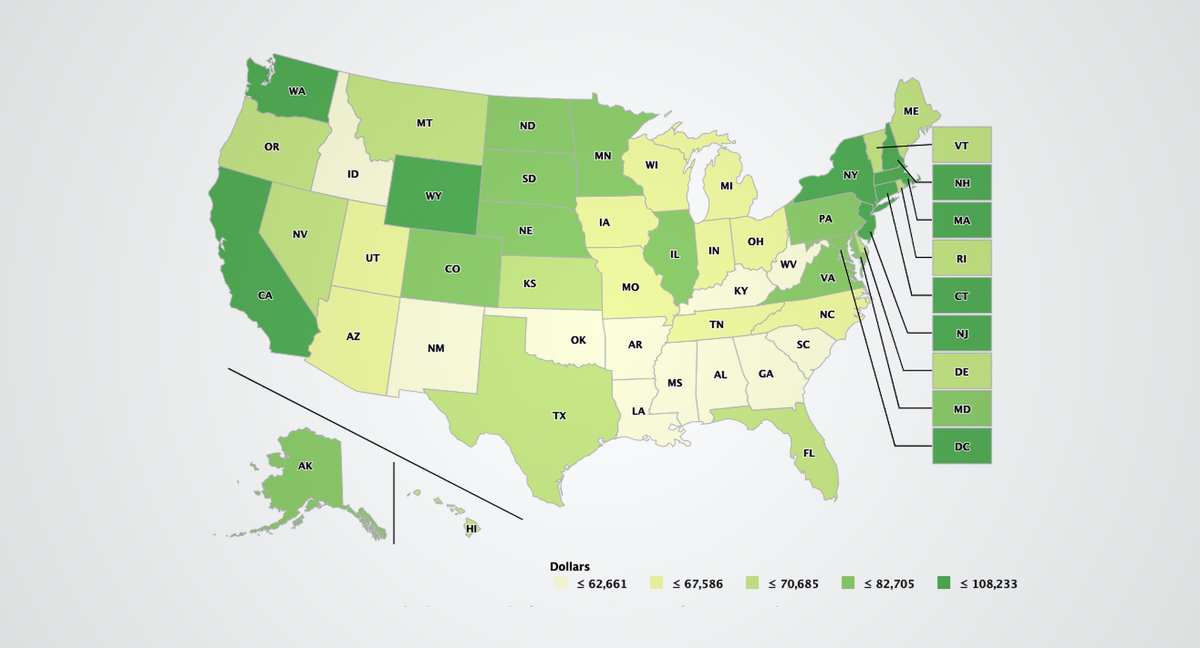
Interactive Map:
While the changes are minor, they demonstrate how even small revisions can affect long-term economic analyses.
What to Do with This Data
Per capita personal income is one of the most commonly used indicators of a state’s economic performance. It reflects wages, dividends, rent, government benefits, and other forms of income, averaged per resident. Policymakers, researchers, and residents alike use this metric to track standard of living and evaluate growth over time.
This page will remain updated as new BEA data becomes available—making it a reliable resource for anyone monitoring income trends in California.
Learn More