
As Texas and New Mexico recover from devastating floods, NASA data reveals a looming threat to California's coast
In the wake of deadly flash floods in the southern United States, attention is turning to a slower-moving flood threat unfolding in California.

As Americans grapple with the deadly aftermath of catastrophic flash floods in Texas and New Mexico, a recent study highlights a quieter flood threat unfolding across the country. In California, it’s not extreme weather putting communities at risk. It's the ground itself.
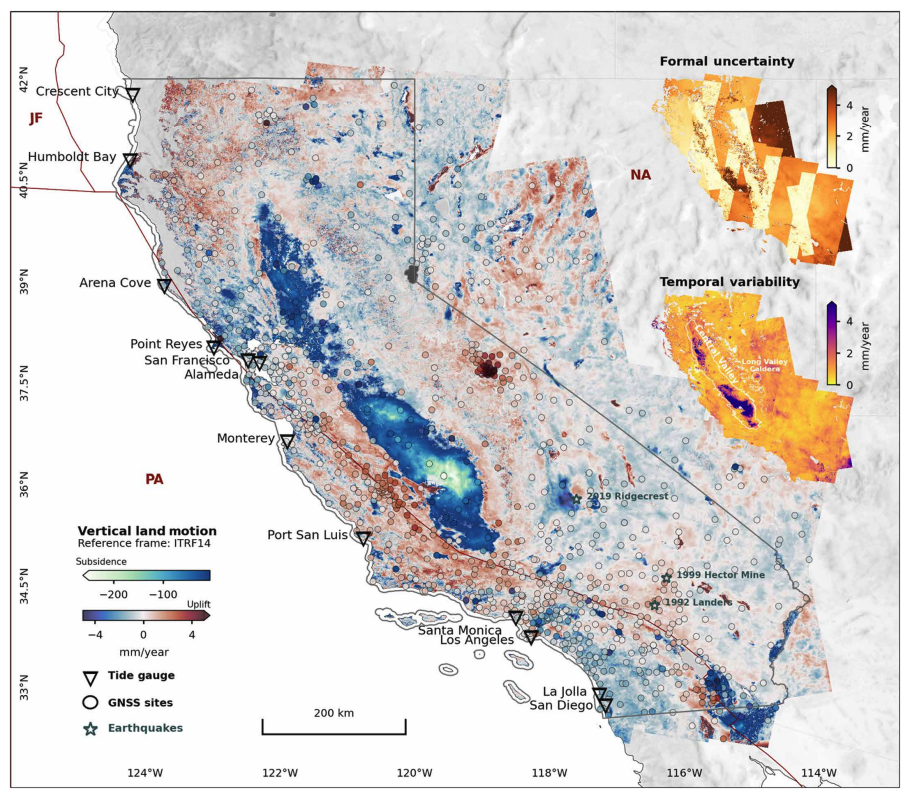
Published in Science Advances in January 2025, the study—“Variable vertical land motion and its impacts on sea level rise projections” —draws on years of NASA satellite radar and ground-based GPS data to map vertical land motion (VLM) along the California coast from 2015 to 2023. The findings reveal that in cities like Los Angeles, San Francisco, and San Diego, localized land subsidence could significantly amplify future sea level rise.
Unlike traditional climate models that assume stable, linear ground conditions, this research documents a chaotic patchwork of sinking land—driven by groundwater pumping, oil extraction, and geological shifts—that may dramatically reshape coastal flood risk in the decades ahead.
This matters now more than ever. California is actively updating its coastal resilience strategies, climate adaptation policies, and infrastructure investments. Without accounting for these newly mapped VLM hotspots, planners could be drastically underestimating future flood risk in some of the state’s most densely populated areas.
What is Vertical Land Motion?
Vertical land motion (VLM) refers to the upward or downward movement of land over time. It can be caused by natural processes like tectonic shifts and sediment compaction, or human activities such as groundwater pumping and oil extraction. There are two key types of VLM:
- Uplift, where land rises relative to sea level
- Subsidence, where land sinks, effectively increasing the height of the sea relative to the land
Most global sea level rise projections—like those used in IPCC reports—focus on oceanic processes such as melting ice sheets and thermal expansion. They tend to treat land as if it’s stable. But in California, that assumption doesn’t hold.
When land sinks, even slowly, it amplifies the effects of rising seas. A city experiencing 3 mm of annual land subsidence will see the ocean appear to rise that much faster—regardless of global sea level trends. In hotspots like Foster City and Long Beach, this “invisible” contributor to sea level rise could mean up to 0.26 meters (10 inches) of additional relative sea level rise by 2050, compared to what regional tide gauge data suggests.
Understanding and integrating VLM is essential for accurate flood forecasting, smart infrastructure design, and long-term planning across California’s vulnerable coastal zones.
Key Findings from the Study
New high-resolution vertical land motion (VLM) data, derived from satellite radar (InSAR) and ground-based GPS (GNSS) observations, reveal an alarming patchwork of sinking land across California. Unlike older, regional IPCC estimates that rely heavily on tide gauge interpolation and assume stable, linear motion, the Govorcin et al. (2025) dataset captures localized subsidence with extreme precision—down to a 90-meter scale.
Major subsidence hotspots identified:
San Francisco Bay Area: Locations like Foster City, Alameda, Bay Farm Island, and parts of the San Francisco Salt Ponds are subsiding by more than 10 mm/year in some places. These changes are not detected by nearby tide gauges, leading to underestimated flood risk.
Southern California: In Long Beach, subsidence is tied to oil extraction and reinjection wells, with rapid trend shifts beginning as recently as 2021. Santa Monica and Chula Vista also show notable downward movement, driven by a combination of urban development, groundwater pumping, and natural geology.
Central Valley: Though inland, the Central Valley shows the most extreme rates of subsidence in the state—exceeding 200 mm/year in some areas—primarily due to aggressive groundwater withdrawal. While not coastal, this has downstream effects on water infrastructure and the freshwater-saltwater balance in estuaries.
In all of these cases, the study’s authors found temporal variability—meaning the land isn’t just sinking, it’s doing so nonlinearly, changing pace in response to precipitation, drought, or industrial activity.
Where California’s Coast Is Sinking Fastest
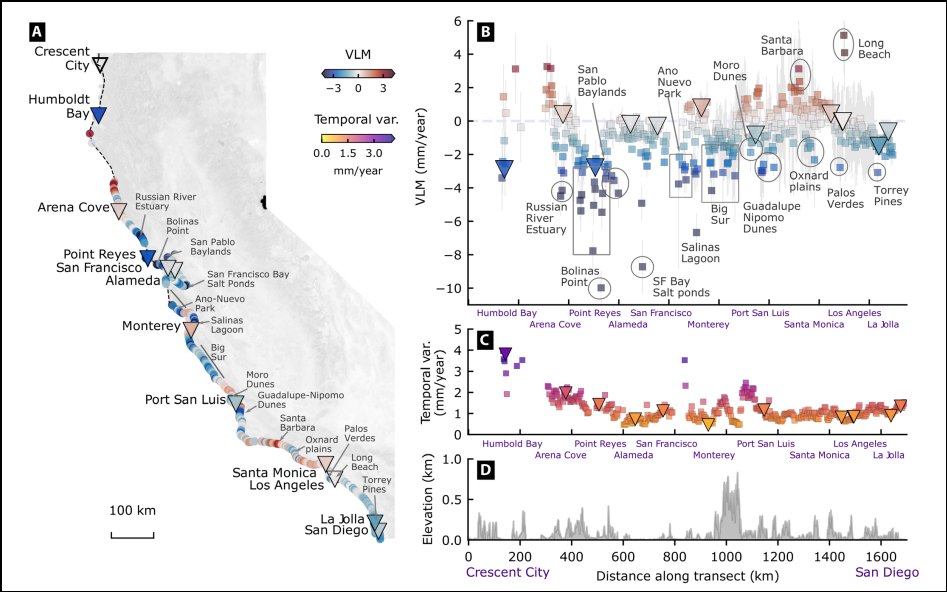
While subsidence in California is widespread, certain coastal segments are far more dynamic than others. Using an annotated 1,700-kilometer transect along the coast, Govorcin et al. visualized where VLM varies the most dramatically.
Key localized insights:
Big Sur: The rugged cliffs are experiencing slow but persistent downward motion, likely related to slow-moving landslides. These areas are at risk of sudden failure and erosion-driven coastline retreat.
Santa Clara and Oxnard Plains: These urban-agricultural zones are showing highly variable subsidence, associated with aquifer recharge and saline intrusion. Rates fluctuate depending on seasonal and industrial water use.
San Pablo Baylands and Torrey Pines: Marshlands and cliff areas such as Torrey Pines State Park show notable subsidence with high temporal variability, indicating unstable ground conditions. These areas may become increasingly vulnerable to cliff collapse or tidal erosion.
The takeaway: even areas with low elevation change in the short term may be unstable over time, and their inclusion in flood maps and coastal policy frameworks must be reevaluated accordingly.
Together, these high-resolution findings make one thing clear: California’s coastline isn’t sinking uniformly—it’s shifting in complex, location-specific ways that demand tailored responses.
Why Regional Estimates Understate the Problem
While regional sea level projections—like those used in the IPCC’s Sixth Assessment Report (AR6)—have improved significantly in recent years, they still fall short in one crucial way: they assume uniform, linear rates of land motion, typically extrapolated from tide gauge locations. This approach misses the more complex, often nonlinear and hyperlocal behavior of California’s shifting coastline.
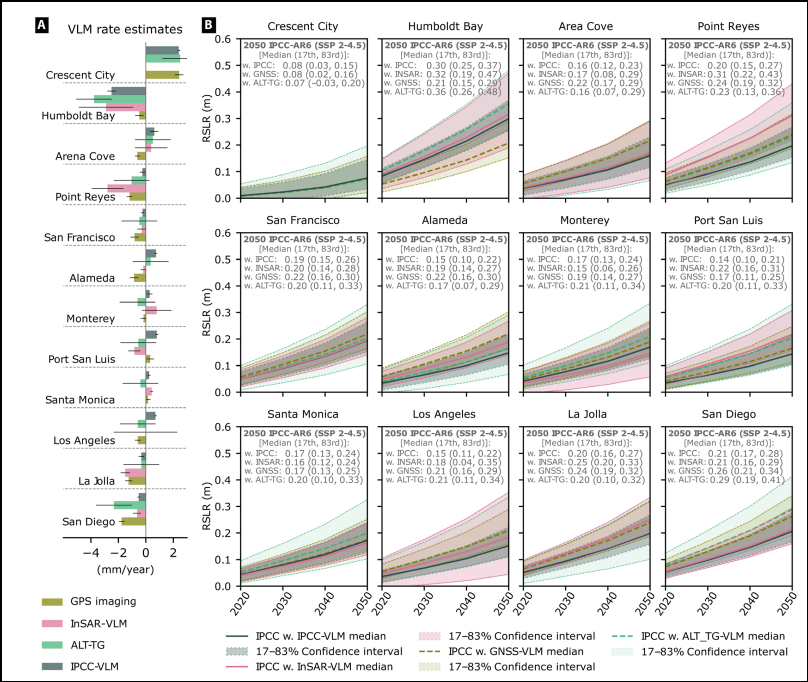
Across nearly every tide gauge studied, InSAR-based VLM data projected 2 to 8 centimeters more relative sea level rise (RSLR) by 2050 than IPCC estimates. For instance:
- At La Jolla: InSAR projects –1.51 mm/year of land motion, compared to the IPCC's –0.33 mm/year
- At Alameda: InSAR shows minor subsidence, while IPCC data inaccurately suggests uplift
- At Port San Luis: The discrepancy is so large that the IPCC projects a net uplift, while InSAR reveals clear sinking land
These differences compound over time, leading to significantly underestimated flood risk in many places. The implications are serious:
- Tide gauges, while useful, don’t capture the full picture—especially in areas miles from the nearest instrument
- Infrastructure like roads, airports, levees, and wastewater systems could be misclassified under FEMA maps if based on outdated or regionalized land motion estimates
- Insurance rates, zoning decisions, and adaptation funding might be wrongly prioritized
Ultimately, this research reinforces the need for high-resolution, locally calibrated projections when planning for sea level rise—especially in the most densely developed parts of the state.
Which Cities Are Most at Risk
The study doesn’t just suggest California is sinking—it identifies exactly where the biggest threats lie, with detailed VLM time series and projections through 2050. These localized forecasts reveal how much more vulnerable some communities are compared to regional estimates.
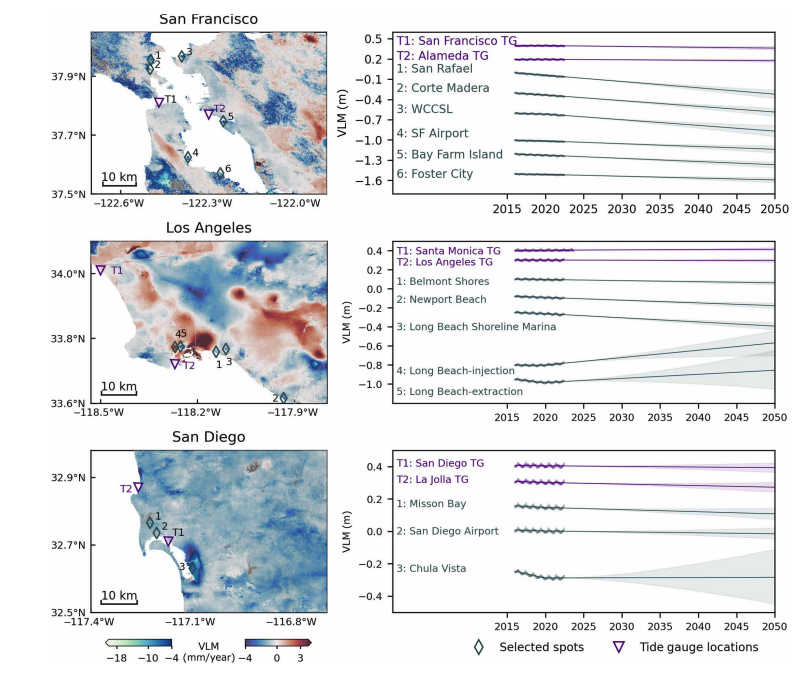
San Francisco Bay Area
- Foster City, Bay Farm Island, and San Francisco International Airport (SFO) are experiencing rapid subsidence, with VLM contributing up to 0.26 meters (26 cm) of additional sea level rise by 2050.
- Combined with ocean rise, these locations could see up to 45 cm of relative sea level rise—more than double the regional projection.
Los Angeles
- Belmont Shores, Newport Beach, and Long Beach Shoreline Marina are all at risk due to nonlinear trend shifts linked to oil injection and extraction wells.
- After 2021, these areas began sinking more quickly, making previous projections obsolete. Some locations may see 0.25 to 0.41 meters of RSLR just from land subsidence alone.
San Diego
- In Mission Bay, vertical land motion adds 2 cm more to sea level rise than nearby tide gauge measurements would suggest.
- Chula Vista, meanwhile, shows high temporal variability, leading to 0.34 meters of uncertainty in 2050 projections—far greater than the regional norm.
Each of these cities has critical infrastructure—airports, levees, highways, ports—that may be far more vulnerable than official flood models indicate. If adaptation plans continue relying on generalized data, the cost of inaction or miscalculation could be measured in billions.
As California finalizes its next phase of resilience planning, these findings serve as a crucial call to recalibrate our coastal playbook.
Policy Implications: California’s Adaptation Plans Must Evolve
California has been a national leader in climate resilience planning, but the Govorcin et al. (2025) study raises urgent questions about whether the state’s current tools are keeping pace with rapidly changing risks. The 2024 Sea Level Rise Guidance issued by the Ocean Protection Council (OPC) was a major step forward—but it’s built on the same regional VLM models that this new research now calls into question.
In key regions such as the San Francisco Bay Area and Southern California, entire neighborhoods, airports, and marshlands are sinking faster than previously understood. This undermines the accuracy of:
- Infrastructure vulnerability assessments
- Floodplain maps and FEMA designations
- Insurance risk models
- Coastal permitting and zoning decisions
It also has direct implications for coastal restoration efforts, including:
- The San Francisco Salt Ponds, where sinking land could offset wetland restoration gains
- The Oxnard Plain, where groundwater-related subsidence may reduce the long-term viability of aquifer recharge and coastal buffer zones
Without incorporating hyperlocal VLM data, California’s resilience investments may be misallocated or insufficient, especially in places where trend shifts are already accelerating.
Closing: California’s Sinking Coast Is a Wake-Up Call
The ocean isn’t the only thing rising—the ground beneath our feet is falling, and in some places, it’s doing so fast enough to double the threat of sea level rise within a generation.
Vertical land motion has long been a blind spot in sea level science. But thanks to advanced satellite radar and GPS integration, we now know how much that blind spot has been costing us—in missed warning signs, underestimated projections, and underprepared communities.
We can’t stop tectonics or reverse decades of groundwater withdrawal overnight. But we can choose to plan smarter. We now have the tools, data, and scientific consensus to make our models—and our policies—match the physical realities unfolding along California’s coast.
The only question left is: will we use them in time?


