
2025 CHHS Program Dashboard guide: How to navigate California Health & Human Services data
This guide offers clear explanations of how to use the CHHS Dashboard tools to explore California’s public assistance data, demographics, and co-enrollment patterns.

The California Health & Human Services (CHHS) Program Dashboard is a suite of interactive data tools designed to help the public explore how safety net programs are used across the state. From single-program participation to multi-program co-enrollment, these tools offer a district- and county-level view of California’s social infrastructure.
With the next round of 5-year data updates expected in late 2025 or early 2026, this guide walks you through how to use the current tools effectively—and how to get the most value out of the most recent available data before it’s refreshed.

Overview of Each Tool
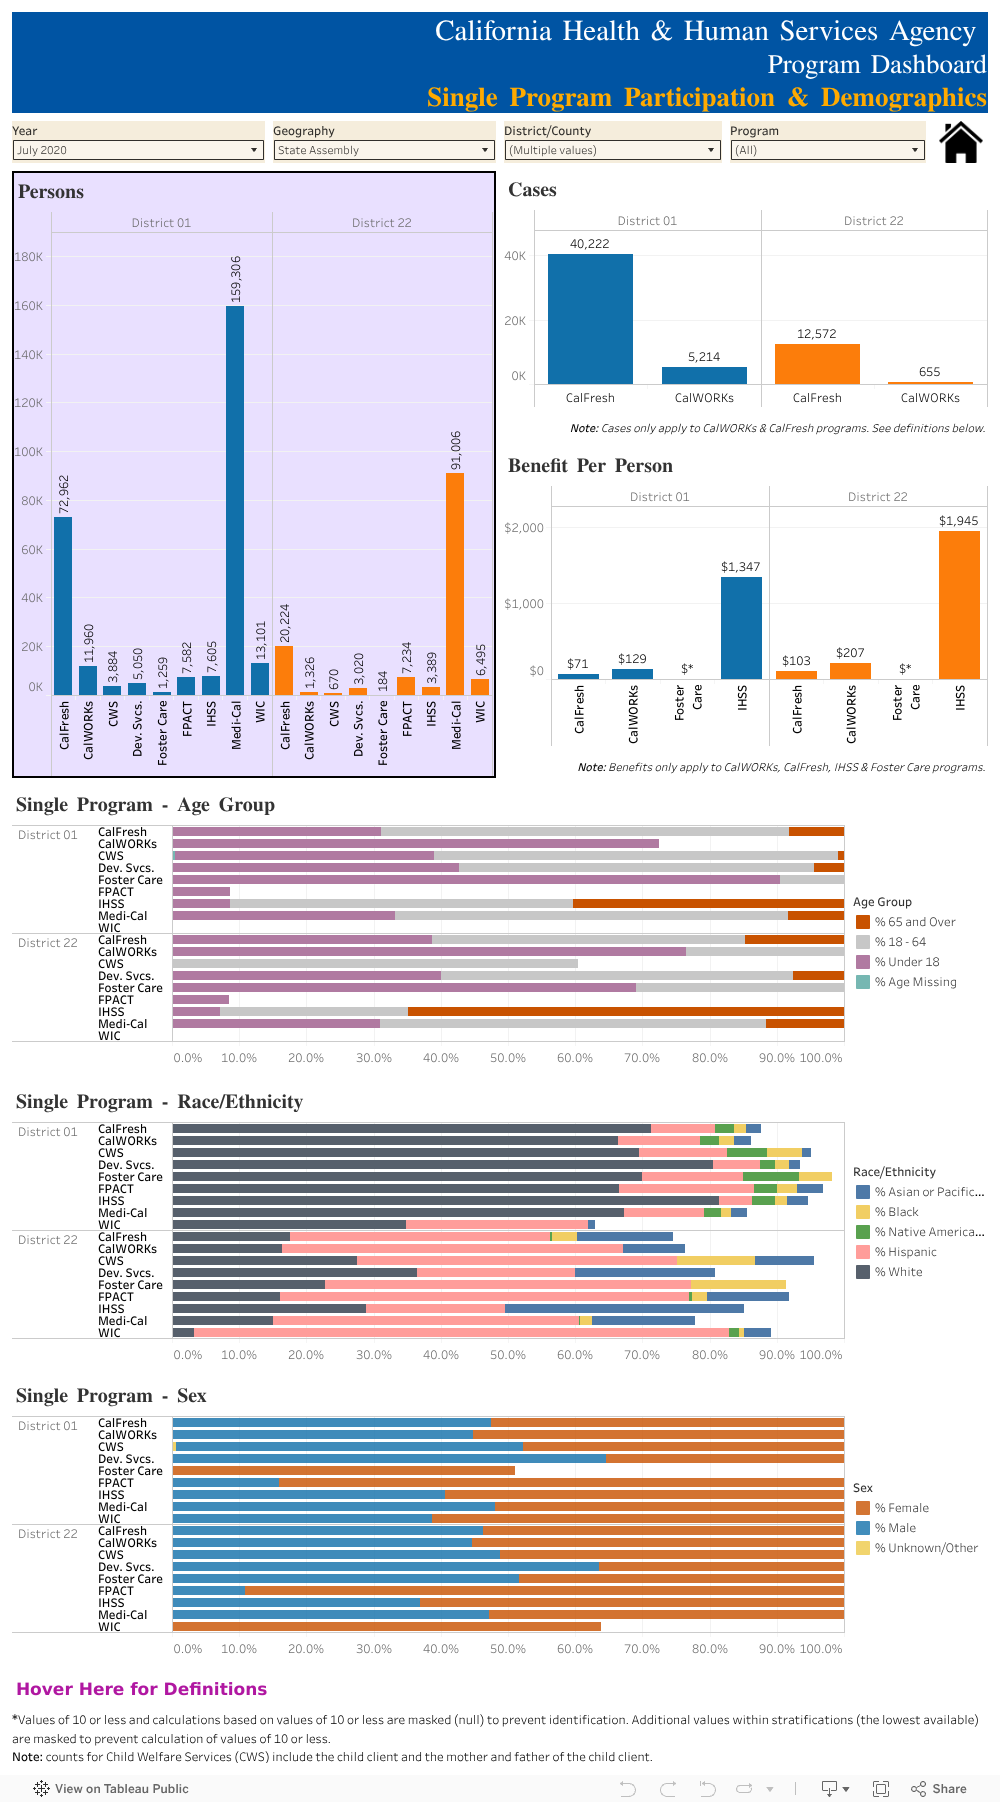
Single Program Participation and Demographics
Breaks down individual program usage—such as CalWORKs, Medi-Cal, and WIC—by demographics, benefit levels, and geography.
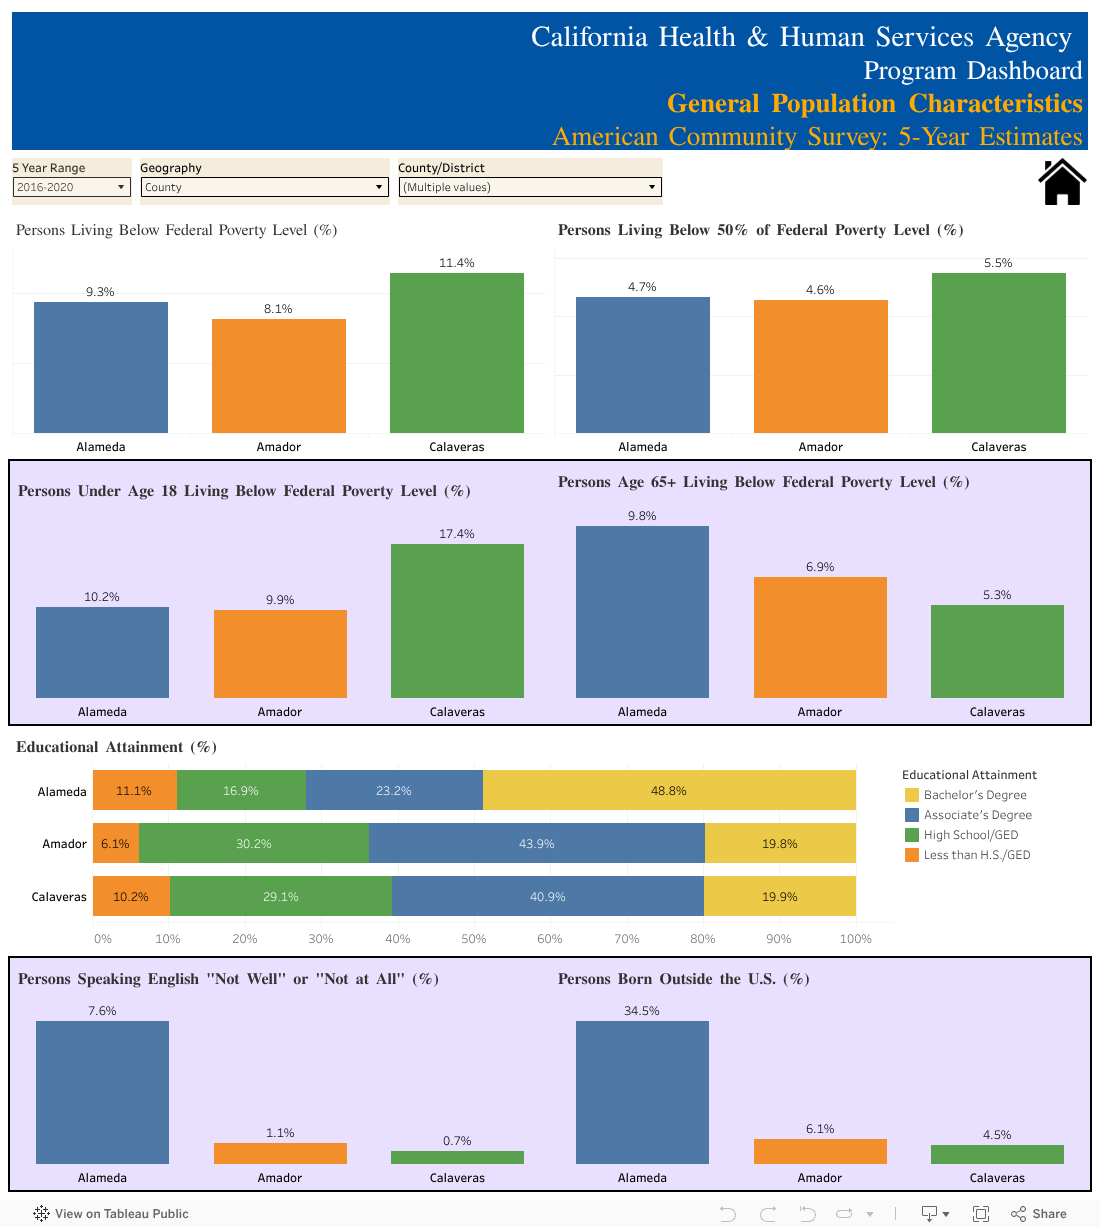
General Population Characteristics
Uses ACS data to show poverty, education, English proficiency, and other key population traits by county or district.
County and District Maps
Visual heatmaps show participation levels in major public programs across counties and legislative districts.

County/District Program Profiles
Shows longitudinal trends in enrollment, demographic composition, and share of statewide program participation for a selected area.

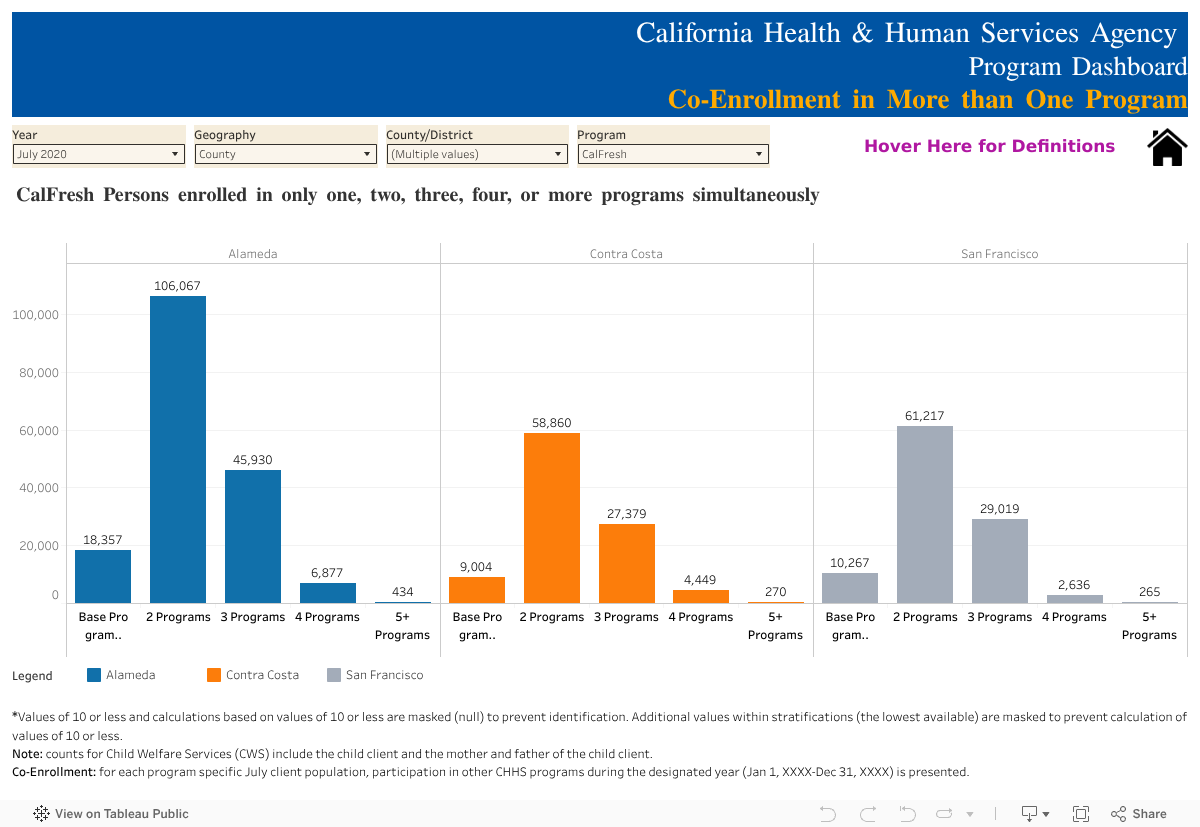
Co-Enrollment in More than One Program
Reveals how many individuals are enrolled in 2, 3, 4, or more programs at the same time—an indicator of depth of need.
Info & Resources
Provides helpful definitions, program descriptions, and source documentation used throughout the dashboard tools.

How to Use These Tools
Each dashboard is interactive and fully embedded on CaliforniaToday.com. You can:
- Filter by program, county, or legislative district
- Choose time ranges (including ACS 5-year estimates)
- Hover over charts for definitions and exact values
- Compare multiple geographies side by side
- Export charts or explore the data in visual or tabular form
Key Interpretation Tips
- Masked Data: Values ≤10 are hidden to protect privacy.
- Time Ranges: ACS data appears in 5-year intervals (e.g., 2016–2020). The next update will likely reflect 2017–2021 or 2018–2022.
- Demographic Context: Use the General Population tool before drawing conclusions from program-specific data.
- Consistency Matters: Compare like timeframes and geographic units for accurate analysis.
Final Thoughts
The CHHS Program Dashboard offers one of the most detailed, user-friendly ways to explore public assistance and demographic data in California. Whether you're comparing counties, analyzing co-enrollment, or tracking population characteristics over time, each tool provides a window into how support programs are used—and where needs are concentrated.
As new data is released in the coming months, this guide will remain a useful reference for navigating the dashboard’s structure and understanding its core metrics. Use it now to explore the current dataset, and return as future updates are published.


