
NASA weather satellite images: An essential resource
NASA’s weather satellite images provide crucial real-time insights into weather conditions in California and beyond, including storms, wildfires, and atmospheric changes.

Accurate and timely weather information is crucial for Californians, whether planning daily activities, managing agriculture, or preparing for severe weather events. NASA's Marshall Space Flight Center provides real-time satellite imagery from the GOES-East and GOES-West satellites, offering comprehensive visual data for tracking weather systems across California and beyond.
Understanding GOES Satellite Imagery
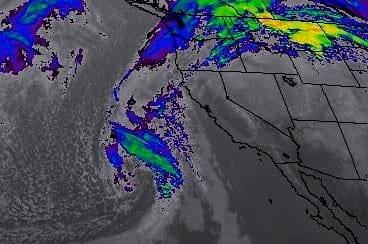
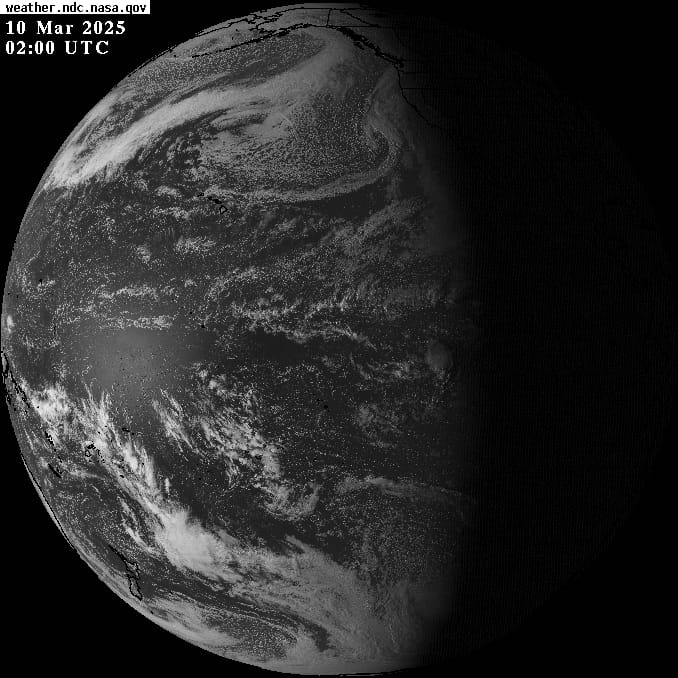
Real-time satellite imagery from NASA's GOES satellites captures detailed views of atmospheric conditions affecting California and the Western Hemisphere, helping to monitor storms, water vapor distribution, and weather events as they unfold. Images courtesy of NASA Marshall Space Flight Center.
The Geostationary Operational Environmental Satellites (GOES) provide continuous monitoring of weather phenomena, offering detailed imagery that enhances our understanding of current and developing weather conditions. These satellites capture data in multiple spectral bands, each serving a unique purpose:
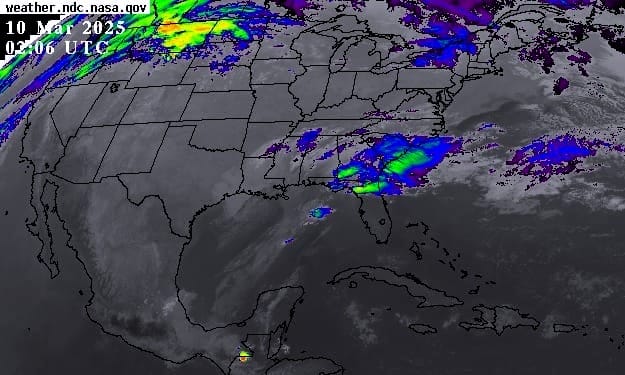
GOES-East Imagery Bands
CONUS
- Band 2 (0.64 µm) – Red Visible: Clear visual detail of clouds and storms during daylight.
- Band 5 (1.61 µm) – Snow/Ice Near-Infrared: Detects snow and ice for accurate monitoring.
- Band 7 (3.90 µm) – Shortwave Infrared: Identifies wildfires and heat signatures.
- Band 8 (6.19 µm) – Upper-Level Water Vapor: Reveals upper-atmosphere moisture content.
- Band 13 (10.35 µm) – Clean Longwave Infrared: Analyzes cloud temperatures and storm intensity.
- Band 14 (11.20 µm) – Longwave Infrared: Continuous weather monitoring, particularly effective overnight.

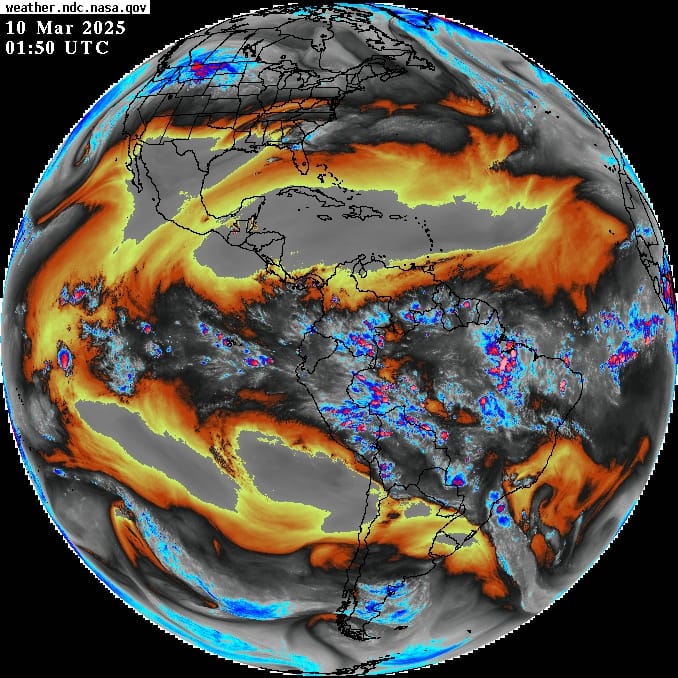
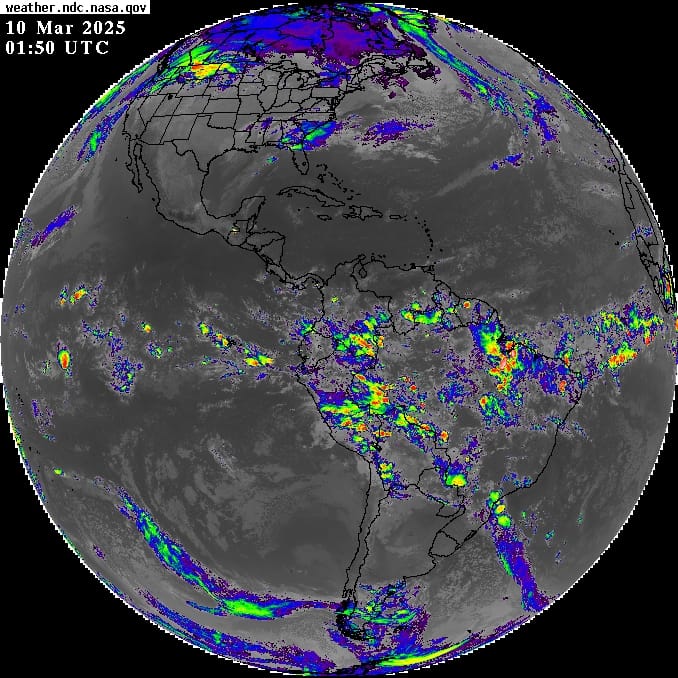
GOES-East Imagery Bands
FULL DISK
- Band 2 (0.64 µm) – Red Visible: Broad-scale visual cloud coverage.
- Band 5 (1.61 µm) – Snow/Ice Near-Infrared: Extensive snow and ice monitoring.
- Band 7 (3.90 µm) – Shortwave Infrared: Global-scale wildfire detection.
- Band 8 (6.19 µm) – Upper-Level Water Vapor: Monitors global atmospheric moisture patterns.
- Band 13 (10.35 µm) – Clean Longwave Infrared: Evaluates global storm development.
- Band 14 (11.20 µm) – Longwave Infrared: General weather tracking for global conditions.
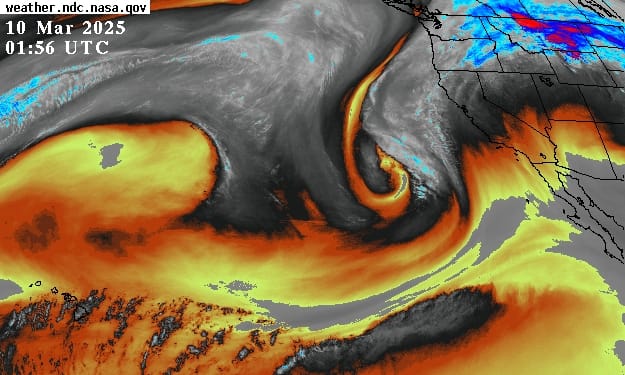
GOES-West Imagery Bands
CONUS
- Band 2 (0.64 µm) – Red Visible: Daylight visual monitoring of cloud structures.
- Band 5 (1.61 µm) – Snow/Ice Near-Infrared: Tracks snowpack and ice formations in detail.
- Band 7 (3.90 µm) – Shortwave Infrared: Precise identification of regional fires.
- Band 8 (6.19 µm) – Upper-Level Water Vapor: Upper-atmosphere moisture detection for forecasting storms.
- Band 13 (10.35 µm) – Clean Longwave Infrared: Monitors storm and cloud intensity.
- Band 14 (11.20 µm) – Longwave Infrared: Continuous day-and-night weather monitoring.
GOES-West Imagery Bands
FULL DISK
- Band 2 (0.64 µm) – Red Visible: Comprehensive daylight imagery of weather patterns.
- Band 5 (1.61 µm) – Snow/Ice Near-Infrared: Large-scale tracking of snow and ice coverage.
- Band 7 (3.90 µm) – Shortwave Infrared: Global wildfire activity monitoring.
- Band 8 (6.19 µm) – Upper-Level Water Vapor: Global atmospheric moisture observations.
- Band 13 (10.35 µm) – Clean Longwave Infrared: Detailed analysis of global storm systems.
- Band 14 (11.20 µm) – Longwave Infrared: Round-the-clock global weather conditions tracking.
These comprehensive satellite imagery resources empower Californians to accurately track weather and environmental conditions, supporting preparedness, planning, and safety across the state.
Nasa Worldview
NASA Worldview provides an interactive platform for exploring real-time satellite imagery, helping Californians monitor weather patterns, wildfires, and environmental changes with high-resolution visuals. Powered by NASA's Earth Observing System Data and Information System (EOSDIS), Worldview offers an intuitive interface to track atmospheric and land surface conditions using data from multiple satellites.
Explore the interactive NASA Worldview tool above to access the latest satellite imagery in real time.
By leveraging NASA’s near-real-time observations, users can analyze cloud formations, storm systems, and temperature variations that impact California’s weather. This tool is especially useful for emergency response teams, meteorologists, and the general public, providing crucial insights into evolving weather events.
Practical Applications for Californians
Wildfire Management
Shortwave infrared imagery quickly detects wildfires, enabling early response and effective resource allocation to manage and contain fires.
Storm and Flood Preparation
Longwave infrared and water vapor imagery help meteorologists predict storm developments and potential flooding events, giving residents vital preparation time.
Agriculture and Resource Management
Farmers and resource managers rely on near-infrared imagery to monitor snow and ice, essential for irrigation planning and water resource management.
How to Access NASA Satellite Imagery
Californians can easily access interactive satellite images directly through NASA's Marshall Space Flight Center Earth Science Branch website.

Real-time and regularly updated, these images are invaluable tools for both professional meteorologists and the general public.


