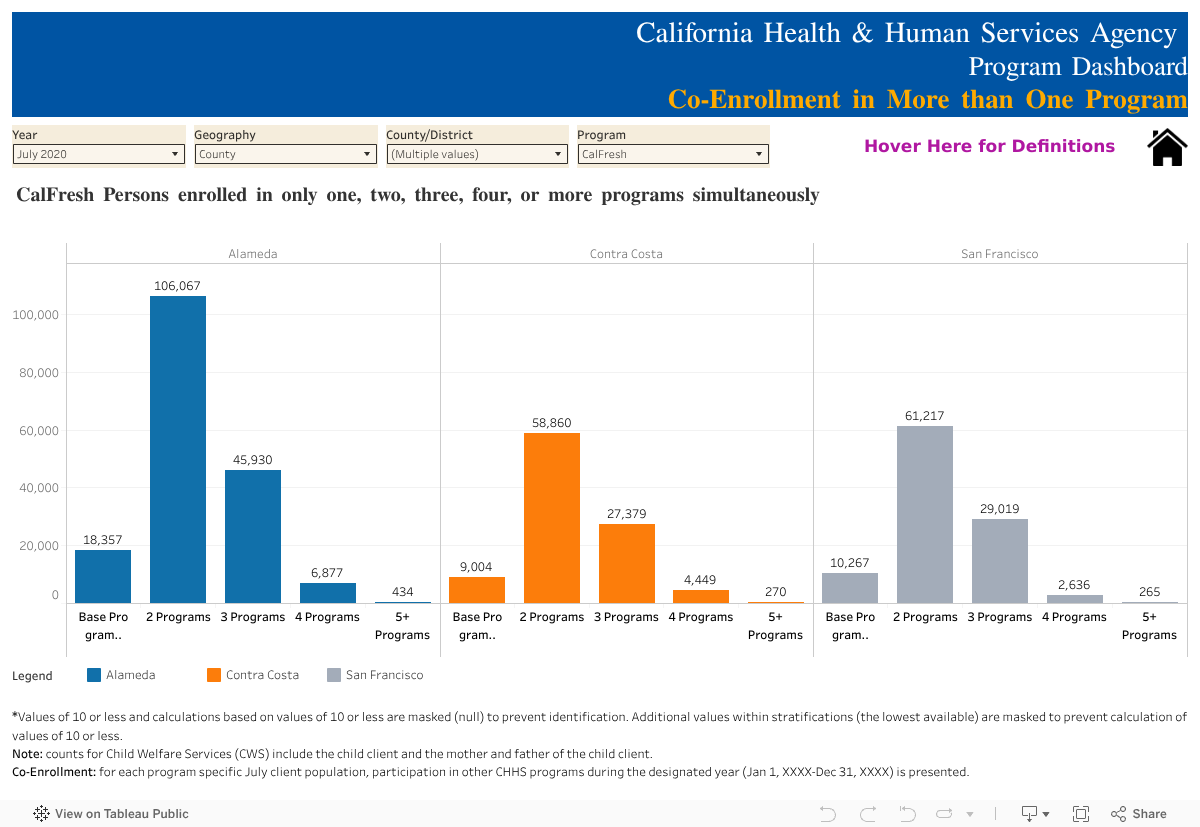
This section of the CHHS Program Dashboard focuses on co-enrollment—the number of individuals who are enrolled in more than one California Health & Human Services (CHHS) program at the same time. The tool provides a clear view of the overlap in service use across counties and districts, helping illustrate the degree of need in different communities.
Whether you're analyzing CalFresh recipients also enrolled in Medi-Cal and WIC, or tracking how many residents access 3+ support services simultaneously, this dashboard gives insight into California’s most vulnerable populations.
Key Features of This Tool
- Co-Enrollment by Program Count:
See how many individuals in each county are enrolled in only a base program (e.g., CalFresh), compared to those enrolled in 2, 3, 4, or 5+ programs simultaneously. - Program Filters:
Select from programs like CalFresh, Medi-Cal, IHSS, and others to view specific co-enrollment patterns for that population. - Geographic Comparisons:
Choose multiple counties or districts to see comparative bar charts side by side. For example, the chart in the screenshot compares Alameda, Contra Costa, and San Francisco. - Privacy-Protected Data:
Any values of 10 or fewer are masked to prevent personal identification, in line with CHHS data-sharing standards. - Year Selector:
Toggle to select different years to assess changes in co-enrollment patterns over time. - Definition Support:
Hover-over definitions explain what constitutes “co-enrollment” and provide context for interpreting the numbers.
Learn More
Understanding co-enrollment is critical to designing policies that address the real-life needs of California residents who rely on multiple forms of public assistance. Use this dashboard to see where the safety net overlaps, how support is distributed, and where gaps in service integration may exist.
Explore Other Tools in the CHHS Program Dashboard:
- Single Program Participation and Demographics
- General Population Characteristics
- County and District Maps
- County/District Program Profiles
If you would like to see more tools like this, review the interactive maps, datasets, and dashboards below.