This interactive tool from the CHHS Program Dashboard provides a detailed breakdown of single program participation across the state. Users can explore how individual CHHS public assistance programs—such as CalWORKs, CalFresh, Medi-Cal, WIC, and In-Home Supportive Services—are accessed by different populations within specific counties and legislative districts.
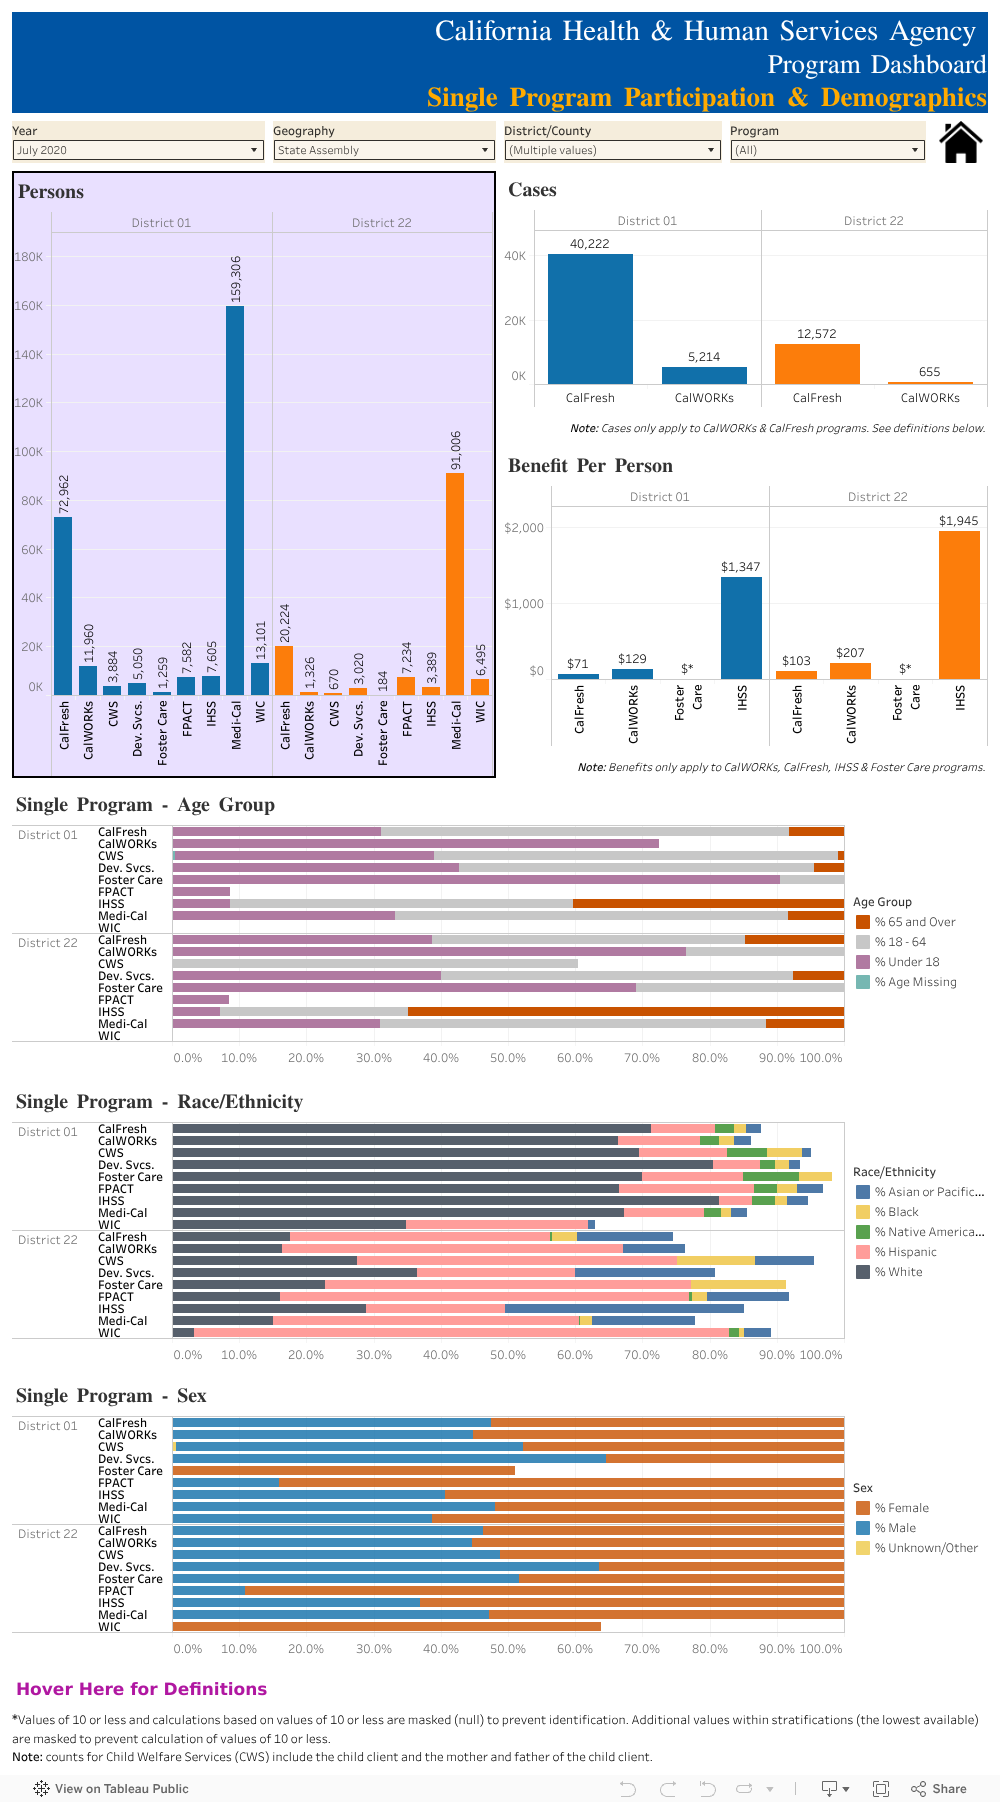
Visualized by district and program, this dashboard shows not only the total number of persons served, but also demographic insights such as age group, race/ethnicity, and gender, along with benefit per person data for select programs.
Key Features of This Tool
- Total Persons Served:
Bar charts display raw participation numbers by program and district. - Cases by Program:
For CalWORKs and CalFresh, case counts provide insight into household-level engagement. - Benefit Per Person:
This metric shows the average benefit distributed per individual in CalWORKs, CalFresh, Foster Care, and In-Home Supportive Services (IHSS). - Demographics by Age Group:
Horizontal bar graphs break down participation among individuals under 18, ages 18–64, and 65+. - Race/Ethnicity:
Demographic overlays reveal how program use varies across racial and ethnic groups, including Hispanic, White, Black, Asian, and Native American participants. - Gender Identity:
View percentages of male, female, and unknown/other program participants per program. - Legislative District Filters:
Choose from California State Senate, Assembly, or Congressional districts for targeted views.
Learn More
This tool is a powerful resource for policymakers, journalists, researchers, and advocates seeking a more granular understanding of how California's safety net programs serve different communities. Use the filters at the top to customize your view by geography, program, or time period—and discover the story behind the numbers.
Explore Other Tools in the CHHS Program Dashboard:
- General Population Characteristics
- County and District Maps
- County/District Program Profiles
- Co-Enrollment in More than One Program
If you would like to see more tools like this, review the interactive maps, datasets, and dashboards below.