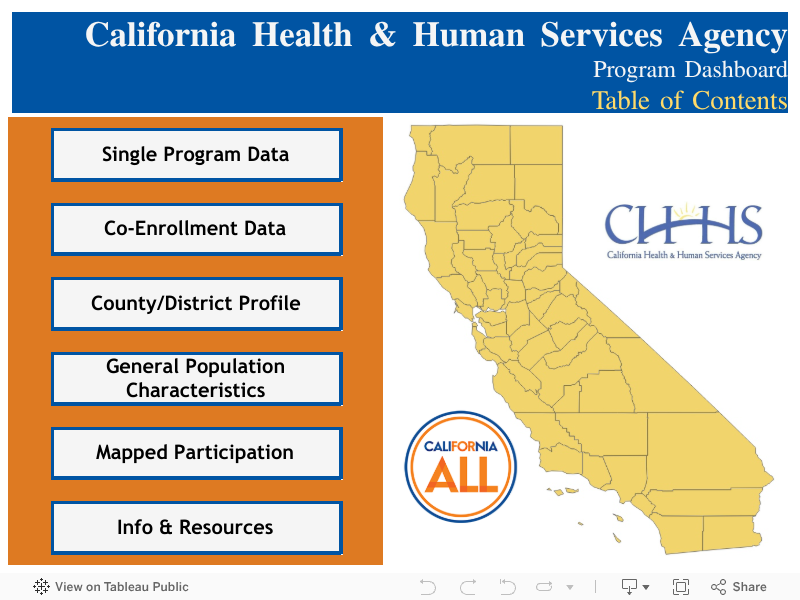
The California Health & Human Services Agency (CHHS) Program Dashboard is an interactive, multi-tool resource designed to help users explore public assistance data across the state. This dashboard includes six distinct tools, each offering a different lens on statewide and local data, ranging from single program usage to mapped demographic overlays.
Whether you're interested in tracking co-enrollment across services, viewing population-level indicators, or examining case data by county, this dashboard allows for deep, customizable analysis—all built with equity and transparency in mind.
Available Dashboard Tools
Each section of the dashboard can be accessed through the interactive buttons above or directly below:
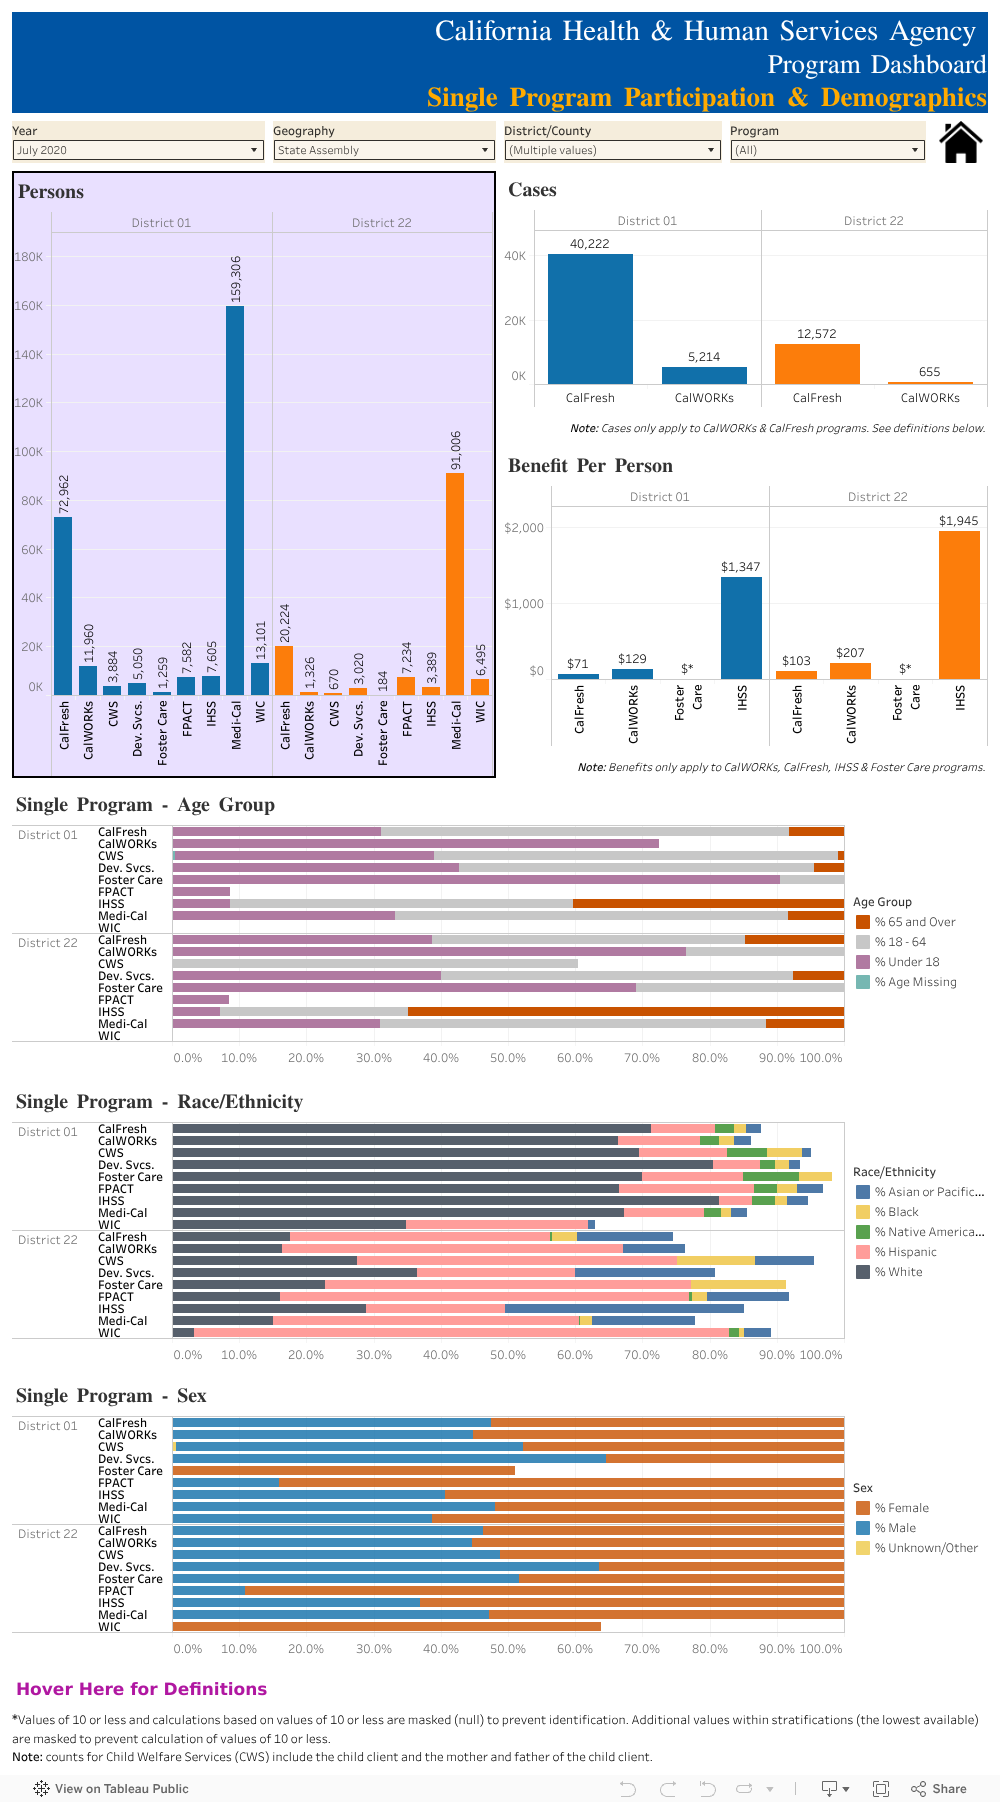
Single Program Data
View statistics on individual CHHS programs such as CalWORKs, Medi-Cal, and WIC, including participation totals, persons per case, and average benefit amounts.
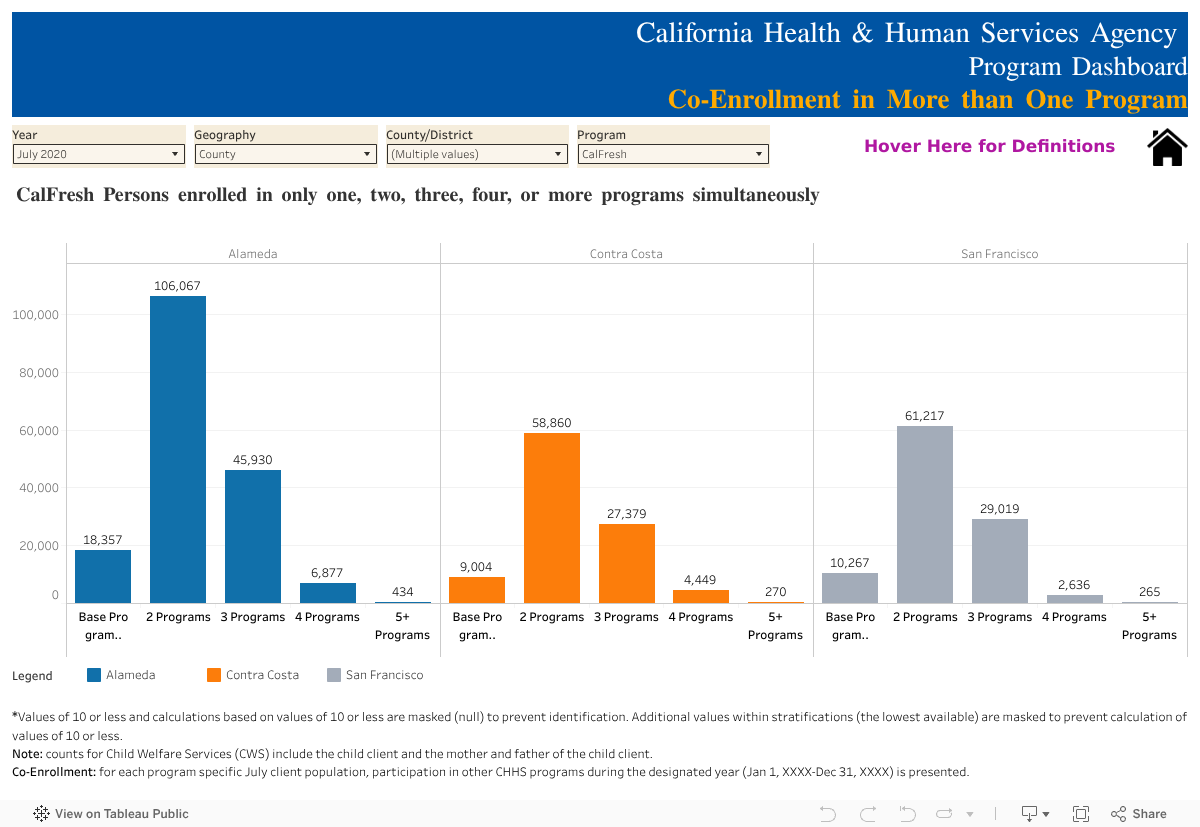
Co-Enrollment Data
Explore how often Californians participate in more than one program at the same time, with filters by district and program type.
County/District Profiles
Access district-level snapshots of key indicators, including enrollment trends, grant distribution, and service overlaps.

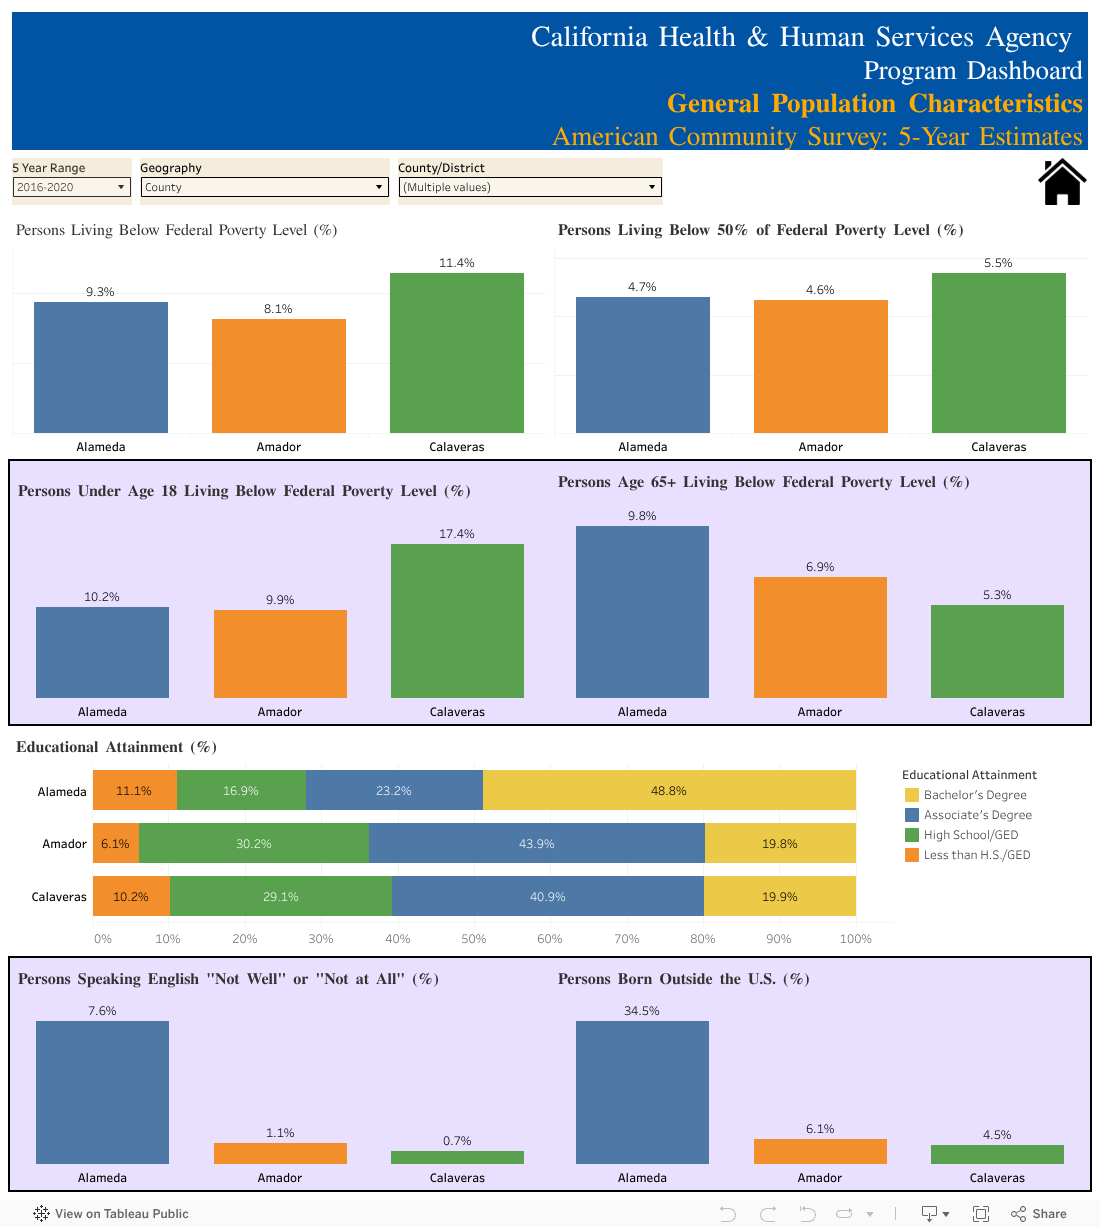
General Population Characteristics
Analyze education levels, English proficiency, poverty rates, and age demographics with county-level breakdowns.
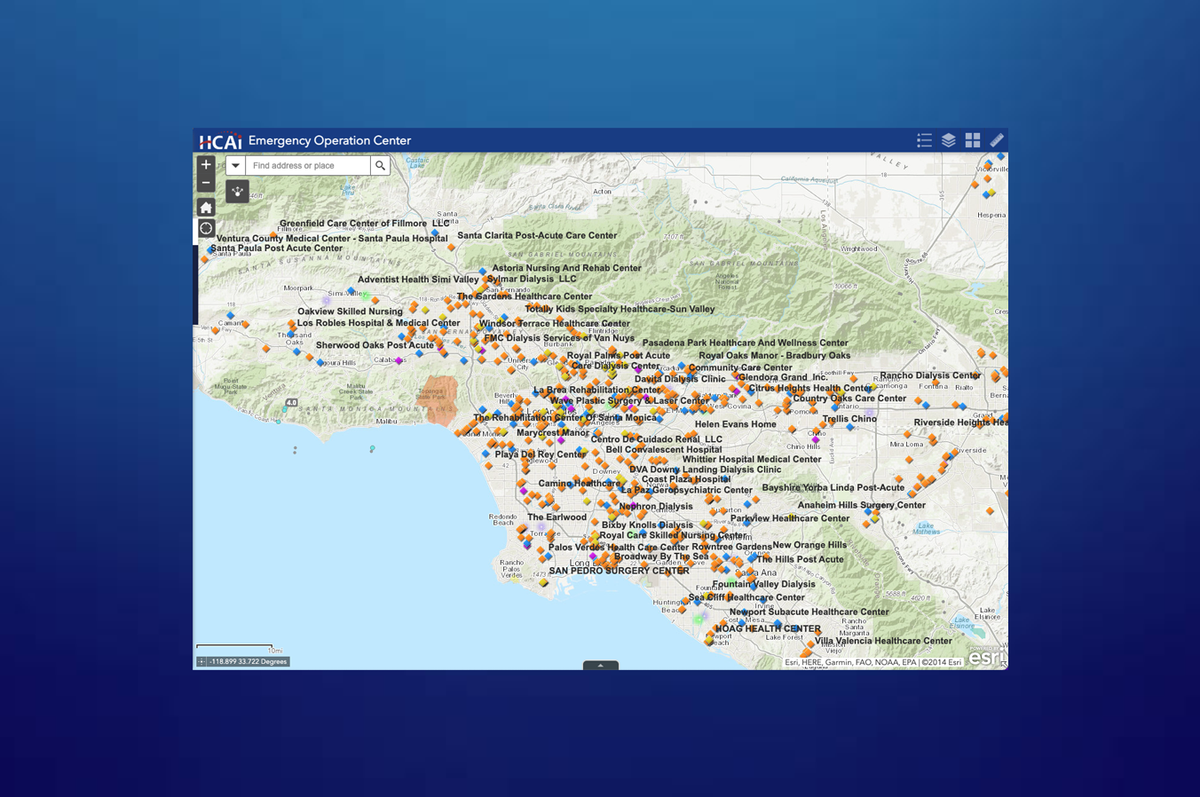
Mapped Participation
Visualize program usage on the map of California with zoom and filter functionality by geography and time frame.

Info & Resources
Get definitions, data notes, program descriptions, and links to further reading—all from the CHHS official resource bank.

Learn More
This dashboard is maintained by the California Health & Human Services Agency and powered by Tableau. It’s publicly accessible and regularly updated to ensure transparency in how public programs are reaching California’s diverse communities.
For more analysis and in-depth reporting, explore our related tools: