This tool within the CHHS Program Dashboard presents American Community Survey (ACS) 5-year estimates related to poverty, education, and population demographics at the county and legislative district level. Developed by the California Health & Human Services Agency (CHHS), it allows users to explore broad social and economic indicators that shape local program participation and community needs.
With side-by-side comparisons of multiple counties or districts, this dashboard provides a data-rich foundation for understanding the demographic context of public assistance in California.
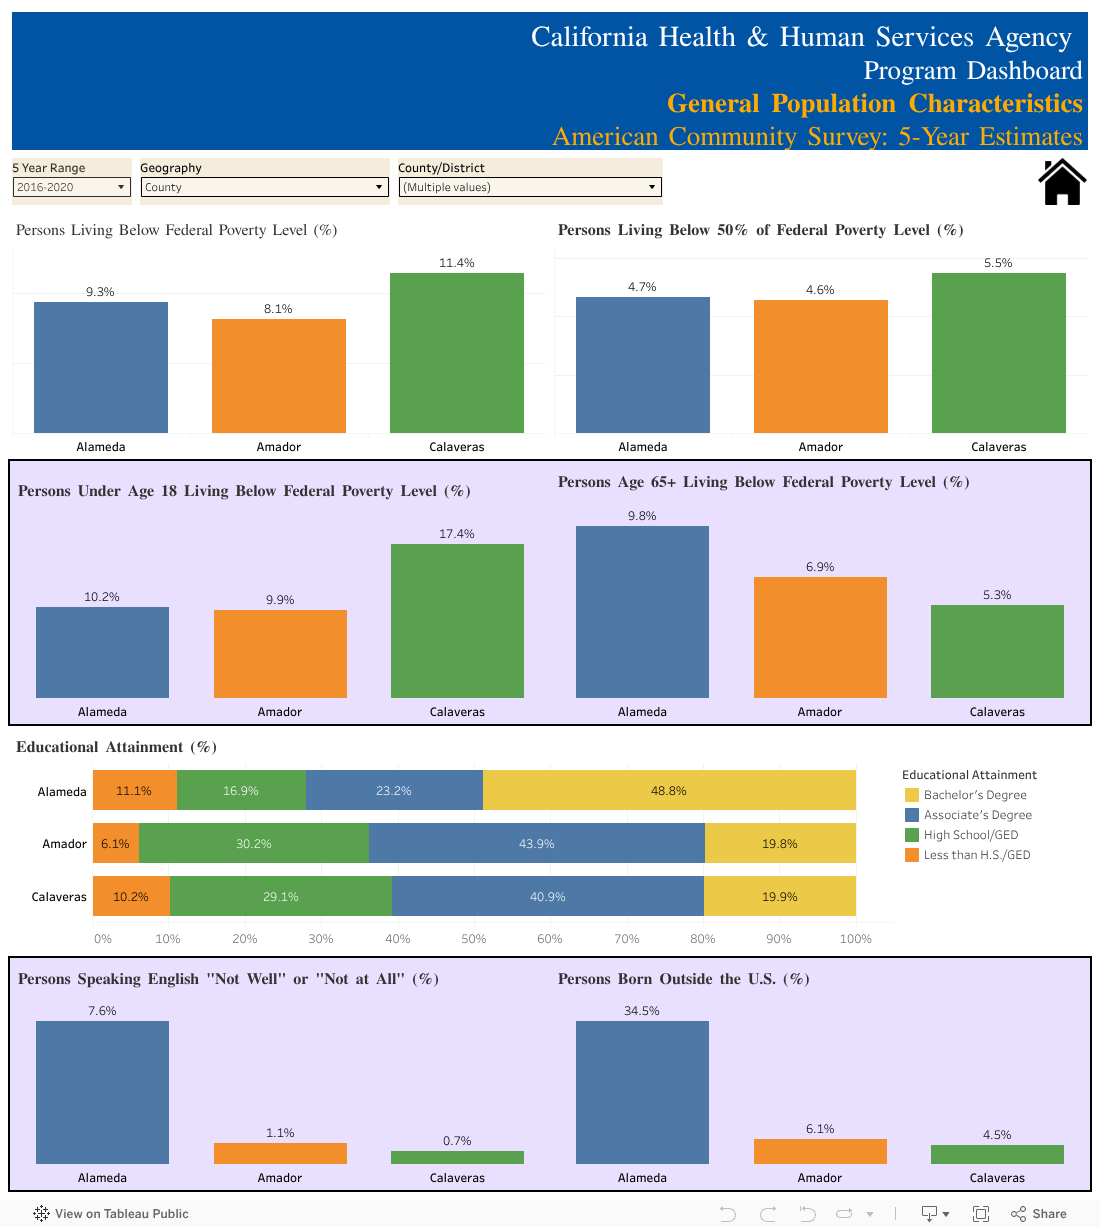
Key Features of This Tool
- Poverty Rates by Threshold:
View the percentage of residents living below the federal poverty line and below 50% of the poverty threshold, offering insight into extreme economic hardship. - Child and Senior Poverty Rates:
Separate indicators show poverty rates among residents under age 18 and age 65+, highlighting generational disparities. - Educational Attainment:
A stacked bar chart displays what percentage of residents have earned a Bachelor’s degree, Associate’s degree, High School/GED, or have not completed high school. - Language Proficiency:
See what portion of each county's population reports speaking English either “Not Well” or “Not at All,” which is critical for program access and communication equity. - Immigration and Place of Birth:
Understand the proportion of the population born outside the United States—key context for eligibility and outreach across public services. - Filter Options:
Toggle between county and district views, and select different 5-year ranges for historical comparisons.
Learn More
Use this dashboard to assess how social determinants of health—like income, education, and language—vary across California. These insights can inform equitable policymaking, program outreach, and community-level resource allocation.
Explore Other Tools in the CHHS Program Dashboard:
- Single Program Participation and Demographics
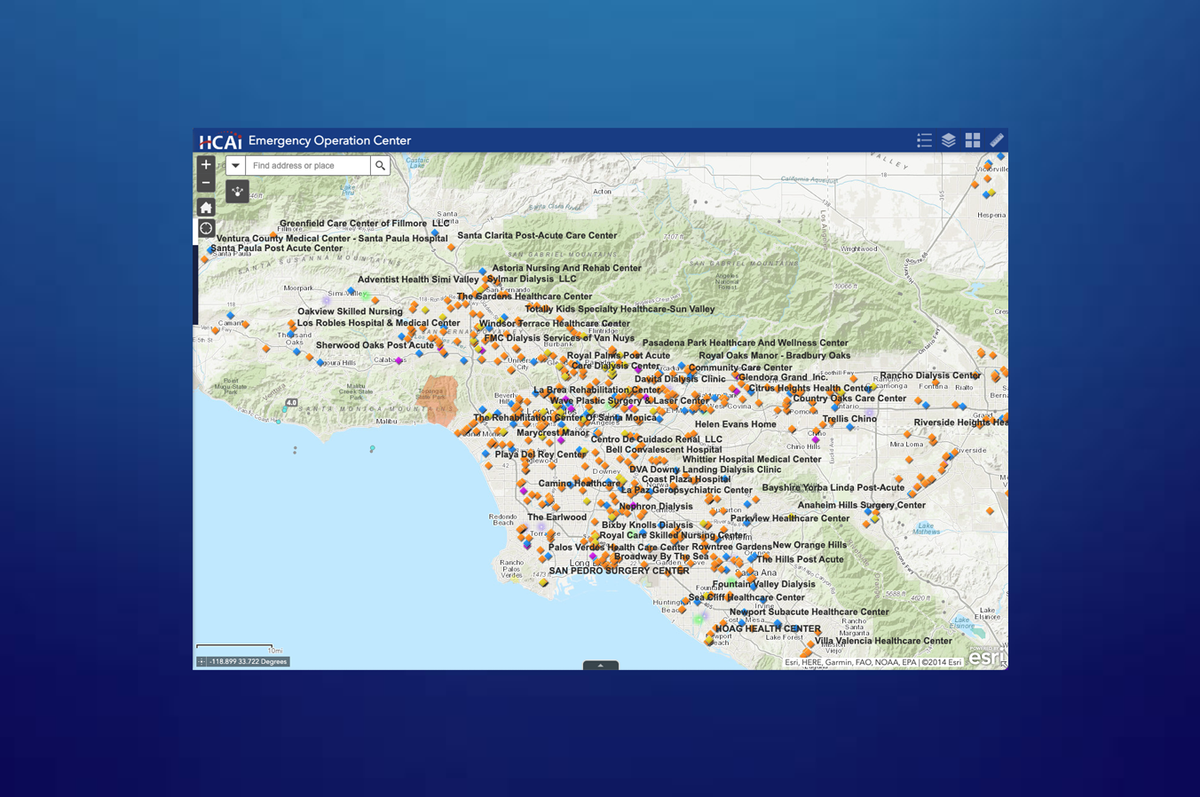
- County and District Maps
- County/District Program Profiles
- Co-Enrollment in More than One Program
If you would like to see more tools like this, review the interactive maps, datasets, and dashboards below.