Beer and wine consumption are declining in California—What to expect from upcoming data
California's latest alcohol consumption data reveals key trends in beer, wine, and spirits sales.


The latest alcohol consumption data from the California Department of Tax and Fee Administration (CDTFA) provides a comprehensive look at how Californians are consuming beer, wine, and spirits. As we await the release of the 2024 data, these figures offer valuable insight into consumption trends and shifting preferences.
Key Findings from the Latest CDTFA Data
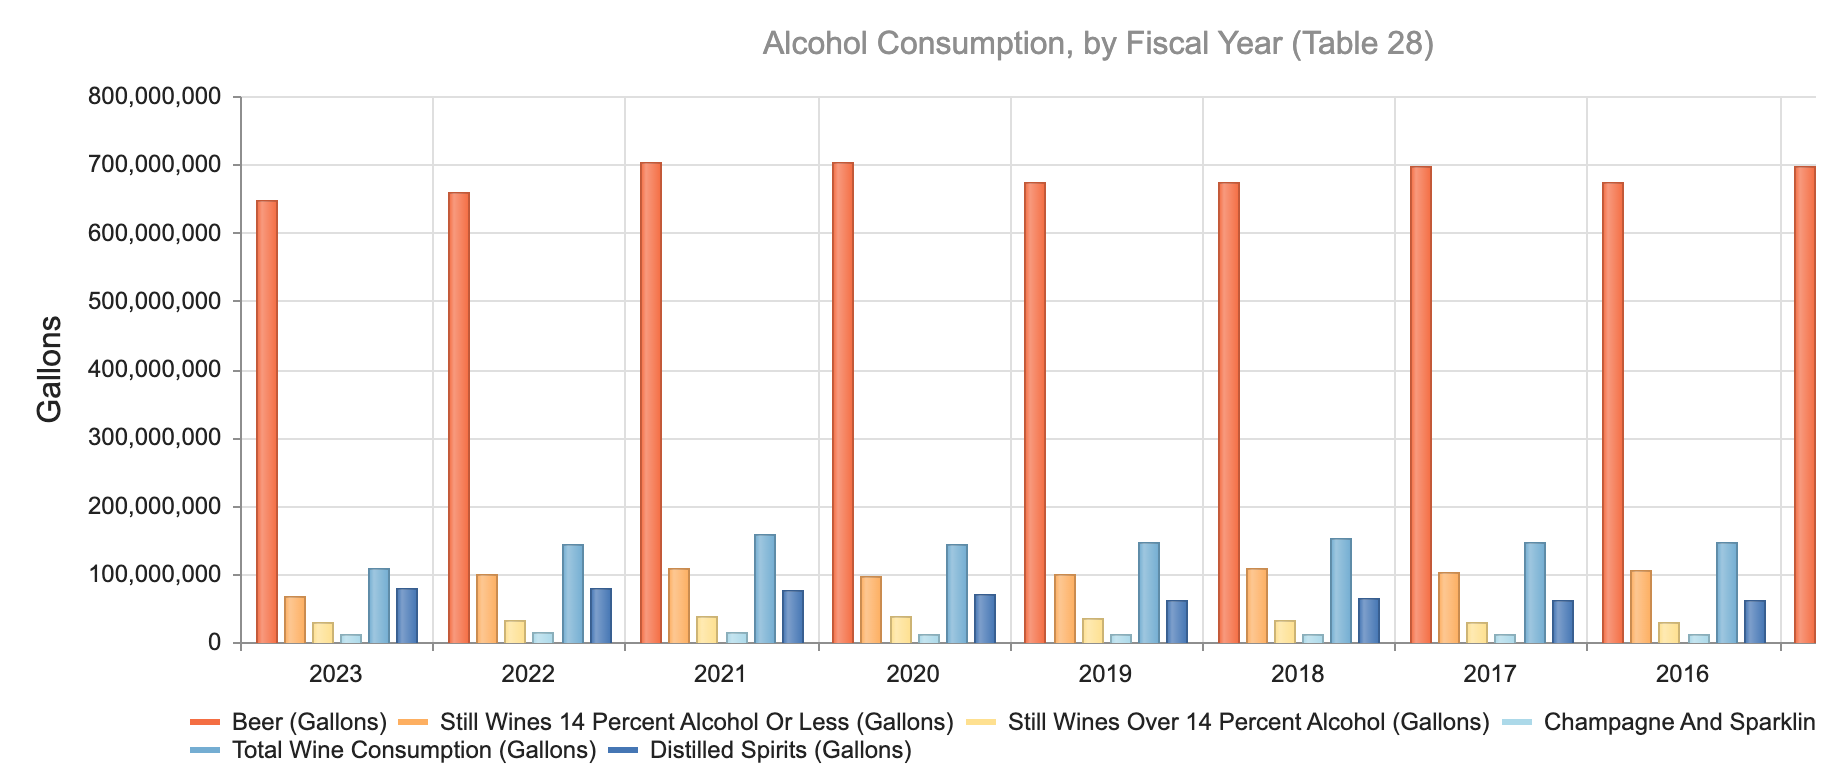
The most current data, covering the fiscal year 2023-24, highlights some notable changes in alcohol consumption across different categories:
- Beer consumption saw a slight decline, with Californians consuming 646.87 million gallons in 2023-24, down from 657.90 million gallons in the previous fiscal year.
- Still wine (14% alcohol or less) sales dropped sharply, declining from 98.71 million gallons in 2022-23 to 66.39 million gallons in 2023-24.
- Stronger still wines (above 14% alcohol) also fell, decreasing to 28.55 million gallons from 30.81 million gallons the previous year.
- Champagne and sparkling wine sales declined, with consumption reaching 12.62 million gallons, down from 14.87 million gallons the year prior.
- Total wine consumption saw a major decrease, dropping from 144.39 million gallons to 107.56 million gallons.
- Distilled spirits sales remained relatively stable, with 79.08 million gallons consumed, compared to 78.68 million gallons the year before.
Interpreting These Trends
| Year From | Year To | Beer (Gal) | Wine ≤14% (Gal) | Wine >14% (Gal) | Sparkling (Gal) | Total Wine (Gal) | Spirits (Gal) |
|---|---|---|---|---|---|---|---|
| 2023 | 2024 | 646.87M | 66.39M | 28.55M | 12.62M | 107.56M | 79.09M |
| 2022 | 2023 | 657.90M | 98.71M | 30.81M | 14.87M | 144.39M | 78.68M |
| 2021 | 2022 | 703.80M | 107.62M | 37.49M | 14.29M | 159.40M | 76.64M |
| 2020 | 2021 | 703.19M | 95.61M | 37.26M | 11.26M | 144.13M | 71.35M |
The latest data suggests that beer and wine consumption is slowing, while spirits remain a steady preference for many Californians. The most significant change appears in the wine category, with an overall 26% decline in total wine consumption year over year. This could be attributed to shifting consumer preferences, price increases, or evolving trends favoring lower-alcohol alternatives and non-alcoholic beverages.
Beer sales, though declining, remain the dominant alcoholic beverage in California, but the decline of over 10 million gallons year-over-year is a sign that consumption habits are changing. Spirits, on the other hand, have shown resilience, with sales remaining relatively stable compared to the previous year.
What to Expect from the 2024 Data
With the 2024 data set to be released soon, our upcoming coverage will analyze whether these trends continue or if new patterns emerge. Questions we’ll explore include:
- Will the decline in wine sales persist into 2024?
- Is beer consumption stabilizing, or will it continue to decrease?
- Are spirits seeing an increase in demand as consumers shift away from wine and beer?
- How do economic factors like inflation and taxation impact alcohol sales?
California’s alcohol consumption trends offer valuable insights into the state's economy, lifestyle choices, and regulatory impacts. Stay tuned for our in-depth analysis once the 2024 data is published.
Final Thoughts
The evolving landscape of alcohol consumption in California highlights changing preferences among consumers. While beer and wine are seeing noticeable declines, the steady demand for spirits suggests a shift in how Californians approach drinking habits. As we anticipate the upcoming 2024 data, we’ll be closely examining these shifts and their potential implications.
Check back soon for our full report on the latest findings from the California Department of Tax and Fee Administration’s 2024 alcohol consumption data release.


