Stay informed and prepared with real-time satellite images providing essential visual data and mapping for California’s diverse weather conditions. Our collection includes images from multiple trusted sources, helping you monitor storms, wildfires, cloud formations, and other important weather patterns statewide.
Browse Satellite Imagery Sources
This page provides satellite imagery from various authoritative providers, each offering unique insights into California's weather.
NASA GOES Satellites
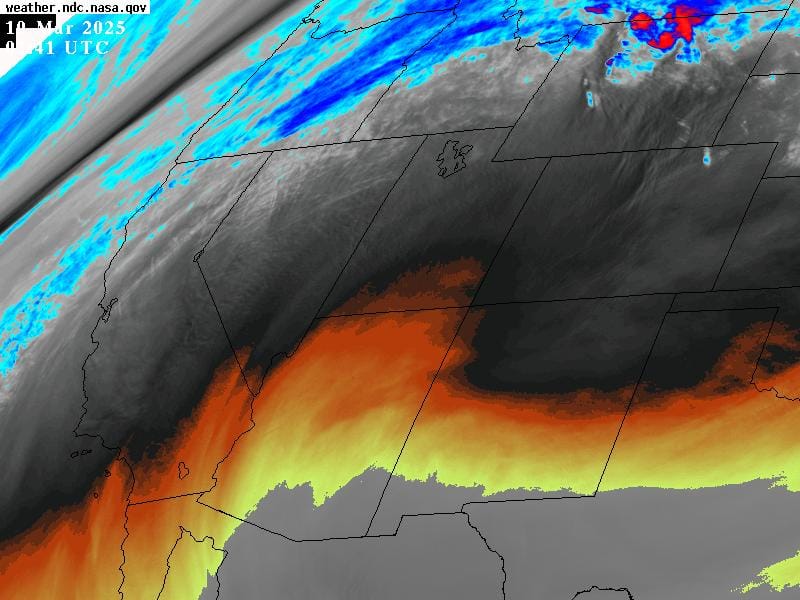
Real-time satellite imagery from NASA's GOES satellites captures detailed views of atmospheric conditions affecting California and the Western Hemisphere, helping to monitor storms, water vapor distribution, and weather events as they unfold. Images courtesy of NASA Marshall Space Flight Center.
NASA's Geostationary Operational Environmental Satellites (GOES) provide continuous monitoring of weather phenomena, offering detailed imagery that enhances our understanding of current and developing weather conditions. These satellites capture data in multiple spectral bands, each serving a unique purpose:
GOES-EAST Imagery Bands
CONUS
- Band 2 (0.64 µm) – Red Visible: Clear visual detail of clouds and storms during daylight.
- Band 5 (1.61 µm) – Snow/Ice Near-Infrared: Detects snow and ice for accurate monitoring.
- Band 7 (3.90 µm) – Shortwave Infrared: Identifies wildfires and heat signatures.
- Band 8 (6.19 µm) – Upper-Level Water Vapor: Reveals upper-atmosphere moisture content.
- Band 13 (10.35 µm) – Clean Longwave Infrared: Analyzes cloud temperatures and storm intensity.
- Band 14 (11.20 µm) – Longwave Infrared: Continuous weather monitoring, particularly effective overnight.
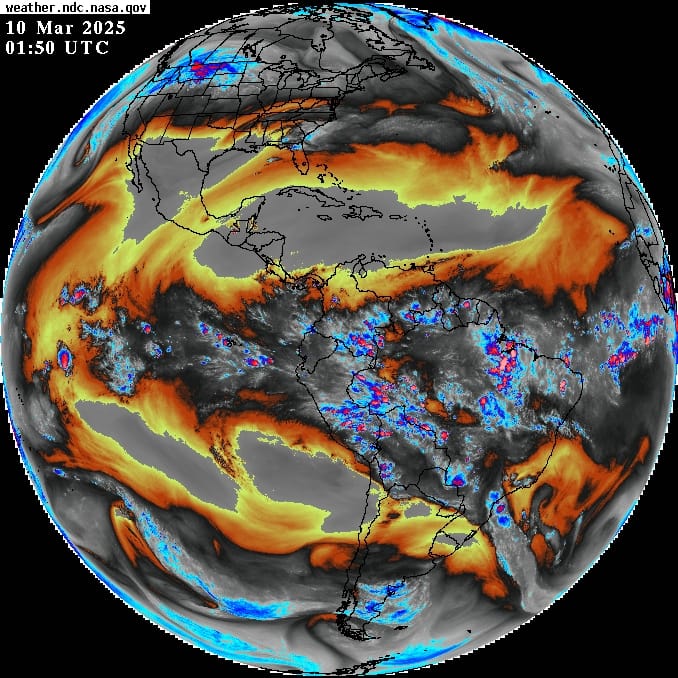
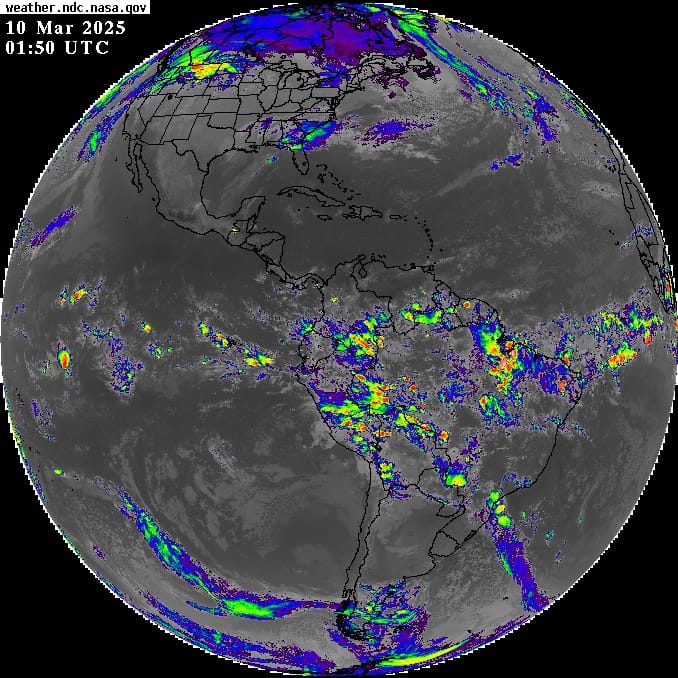
FULL DISK:
- Band 2 (0.64 µm) – Red Visible: Broad-scale visual cloud coverage.
- Band 5 (1.61 µm) – Snow/Ice Near-Infrared: Extensive snow and ice monitoring.
- Band 7 (3.90 µm) – Shortwave Infrared: Global-scale wildfire detection.
- Band 8 (6.19 µm) – Upper-Level Water Vapor: Monitors global atmospheric moisture patterns.
- Band 13 (10.35 µm) – Clean Longwave Infrared: Evaluates global storm development.
- Band 14 (11.20 µm) – Longwave Infrared: General weather tracking for global conditions.
GOES-West Imagery Bands
CONUS:
- Band 2 (0.64 µm) – Red Visible: Daylight visual monitoring of cloud structures.
- Band 5 (1.61 µm) – Snow/Ice Near-Infrared: Tracks snowpack and ice formations in detail.
- Band 7 (3.90 µm) – Shortwave Infrared: Precise identification of regional fires.
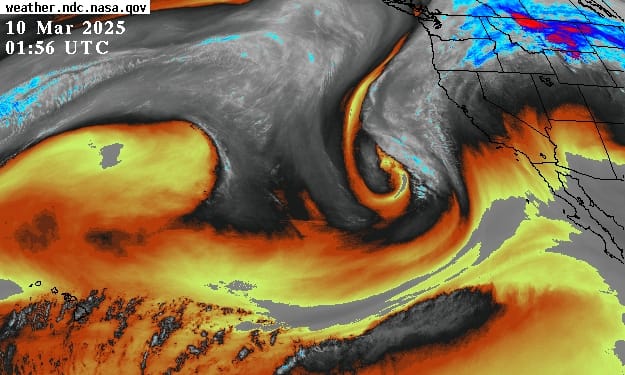
- Band 8 (6.19 µm) – Upper-Level Water Vapor: Upper-atmosphere moisture detection for forecasting storms.
- Band 13 (10.35 µm) – Clean Longwave Infrared: Monitors storm and cloud intensity.
- Band 14 (11.20 µm) – Longwave Infrared: Continuous day-and-night weather monitoring.
FULL DISK:
- Band 2 (0.64 µm) – Red Visible: Comprehensive daylight imagery of weather patterns.
- Band 5 (1.61 µm) – Snow/Ice Near-Infrared: Large-scale tracking of snow and ice coverage.
- Band 7 (3.90 µm) – Shortwave Infrared: Global wildfire activity monitoring.
- Band 8 (6.19 µm) – Upper-Level Water Vapor: Global atmospheric moisture observations.
- Band 13 (10.35 µm) – Clean Longwave Infrared: Detailed analysis of global storm systems.
- Band 14 (11.20 µm) – Longwave Infrared: Round-the-clock global weather conditions tracking.
Practical Applications of Satellite Imagery
- Weather Forecasting: Monitor storms, precipitation, and cloud movements to plan activities.
- Wildfire Tracking: Quickly identify and manage wildfires with specialized infrared imagery.
- Agriculture and Resource Management: Track moisture, snowpack, and weather patterns for effective resource planning.
How to Use This Page
Select a source or imagery type from the options provided to access real-time and regularly updated satellite images tailored to your needs.

Access Real-Time Satellite Images from NASA.
More California Weather Resources