
New California streamflow reports warns of early snowmelt and water supply shifts
California's Spring 2025 peak streamflow forecast predicts high water volumes in major rivers like the Sacramento, Feather, and San Joaquin.

State officials say the amount of water from melting snow in the Sierra Nevada mountains may peak early this year, raising concern about how much water will be available in late summer and fall.
The California Nevada River Forecast Center (CNRFC) has issued its Spring 2025 1-Day Peak Streamflow Volumes summary, providing insights into expected water flow volumes across major rivers in California and Nevada. This forecast, supplemented with new 10-day Streamflow Volume Accumulation data, offers a more detailed look at how seasonal runoff is evolving.
The last two years have shown vast improvements to the snowpack, but California’s new normal means climate extremes can cause significant rain and snow one year and a dry year the next. Even now, while the snowpack in Northern California looks good so far, the lack of rain in… pic.twitter.com/qXyT0Yirjj
— California Department of Water Resources (@CA_DWR) January 2, 2025
The report arrives amid growing worry about the long-term decline in spring snowmelt runoff in the Sacramento and San Joaquin Rivers. The projections, measured in thousands of acre-feet (KAF), guide flood prevention measures, reservoir management, and hydroelectric power generation—all of which are critical to both urban and agricultural water supplies.
Key Takeaways from the Spring 2025 Streamflow Forecast
1. Major Rivers with the Highest Forecasted Streamflows
Several key rivers in California and Nevada are expected to experience significant peak flows, with snowmelt runoff playing a crucial role:
Sacramento River at Shasta
- Median forecast: 67.8 KAF
- Maximum estimate: 98.5 KAF
- Expected peak date range: April 2 – May 19, 2025
- 10-Day Streamflow Accumulation: 42.3 KAF (March 15-25, 2025)
Feather River at Oroville
- Median forecast: 54.7 KAF
- Maximum estimate: 118.4 KAF
- Expected peak date range: April 1 – May 19, 2025
- 10-Day Streamflow Accumulation: 47.9 KAF (March 15-25, 2025)
San Joaquin River at Millerton
- Median forecast: 29.1 KAF
- Maximum estimate: 36.0 KAF
- Expected peak date range: April 28 – June 12, 2025
- 10-Day Streamflow Accumulation: 15.8 KAF (March 15-25, 2025)
Tuolumne River at New Don Pedro
- Median forecast: 33.1 KAF
- Maximum estimate: 50.7 KAF
- Expected peak date range: April 13 – June 10, 2025
- 10-Day Streamflow Accumulation: 21.4 KAF (March 15-25, 2025)
American River at Folsom
- Median forecast: 41.4 KAF
- Maximum estimate: 109.8 KAF
- Expected peak date range: April 4 – May 27, 2025
- 10-Day Streamflow Accumulation: 38.7 KAF (March 15-25, 2025)
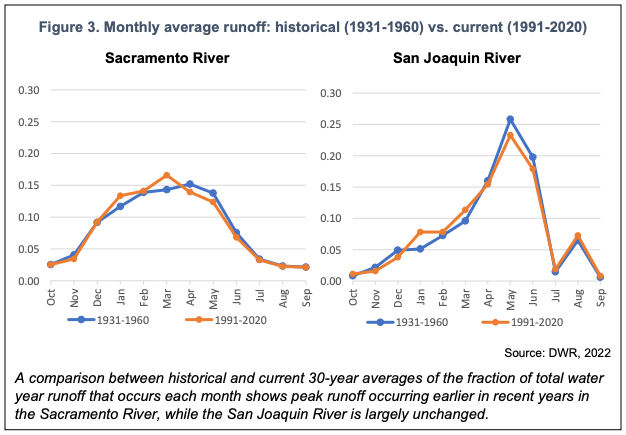
These projections highlight significant inflows into California’s major reservoirs, but historical data from the California Office of Environmental Health Hazard Assessment suggests an increasing proportion of runoff is occurring earlier in the season:
"In the last 30 years, peak runoff has shifted earlier by a month on the Sacramento River (March instead of April), compared to earlier years in the record (1931-1960)." -California Office of Environmental Health Hazard Assessment
2. Potential Flood Risks and Reservoir Impact
With peak streamflows expected in April, May, and June, flood risks remain a major concern. The snowmelt-driven spring runoff has long been a key component of California’s water system, but warmer winter temperatures and changing precipitation patterns have disrupted historical trends.
According to the 2022 Indicators of Climate Change in California,
“Increased winter snowmelt [has been] found to be highly sensitive to temperature in 34 percent of snow monitoring stations across western North America.”
As a result, peak flows can be affected by the following:
Reservoir management challenges
Facilities like Shasta, Oroville, and Folsom may require controlled releases to prevent overflow and flooding, especially if rain-on-snow events increase inflows unexpectedly.
Earlier snowmelt runoff
Data indicates that "Years of 'snow drought' – defined as anomalously low snowwater content – between 1951 and 2017 originated and evolved in various ways... including from extreme early season precipitation, frequent rain-on-snow events, lower fractions of precipitation falling as snow, and midwinter peak runoff events.” A warmer-than-average spring could lead to faster snowmelt, increasing flood risks.
Flash flood risks in vulnerable regions
The report notes that rain-on-snow events have been linked to “mass erosion of slopes, damage to riparian zones, and downstream flooding”, particularly in areas near the Feather, Sacramento, and American Rivers.
Communities near these rivers should stay informed about potential flood warnings from the National Weather Service and local emergency agencies.
3. Agricultural and Hydropower Considerations
Spring runoff plays a critical role in California's water supply for agriculture and hydroelectric power generation, but shifting patterns pose challenges for long-term planning.
Irrigation management
Farmers and irrigation districts will need to adjust water allocations based on reservoir levels and expected meltwater contributions, which historically have provided “about 35 percent of the usable annual supply for agriculture and urban needs”.
Hydropower production
While higher water availability could boost hydroelectric output, earlier runoff patterns may lead to “less available water in warmer months for domestic and agricultural uses, hydroelectric power production, recreation and other uses,” requiring adjustments in energy planning.
Drought resilience
While this year's streamflow outlook is strong, long-term declines in spring snowmelt runoff indicate that drought risk remains an ongoing concern.
What’s Next? How to Stay Updated
The CNRFC’s streamflow forecast provides valuable insight into California and Nevada’s water systems, but actual streamflow volumes will ultimately depend on late-season storms and temperature trends.
For real-time updates and further analysis, visit the California Nevada River Forecast Center: 🔗 www.cnrfc.noaa.gov
Would you like to see this report broken down further by specific river basins or historical trends? Let us know in the comments!


