California snowpack timelapse: Dramatic changes from 2005 to 2025
This 20-year visual journey showcases California's shifting snowpack, highlighting crucial climate trends and water resource challenges from 2005 to 2025.
From 2005 to 2025, California’s snowpack underwent significant and dramatic changes, capturing both historic droughts and unprecedented wet years. This animated timelapse provides a stark depiction of how quickly and profoundly California's vital snow reserves can fluctuate.
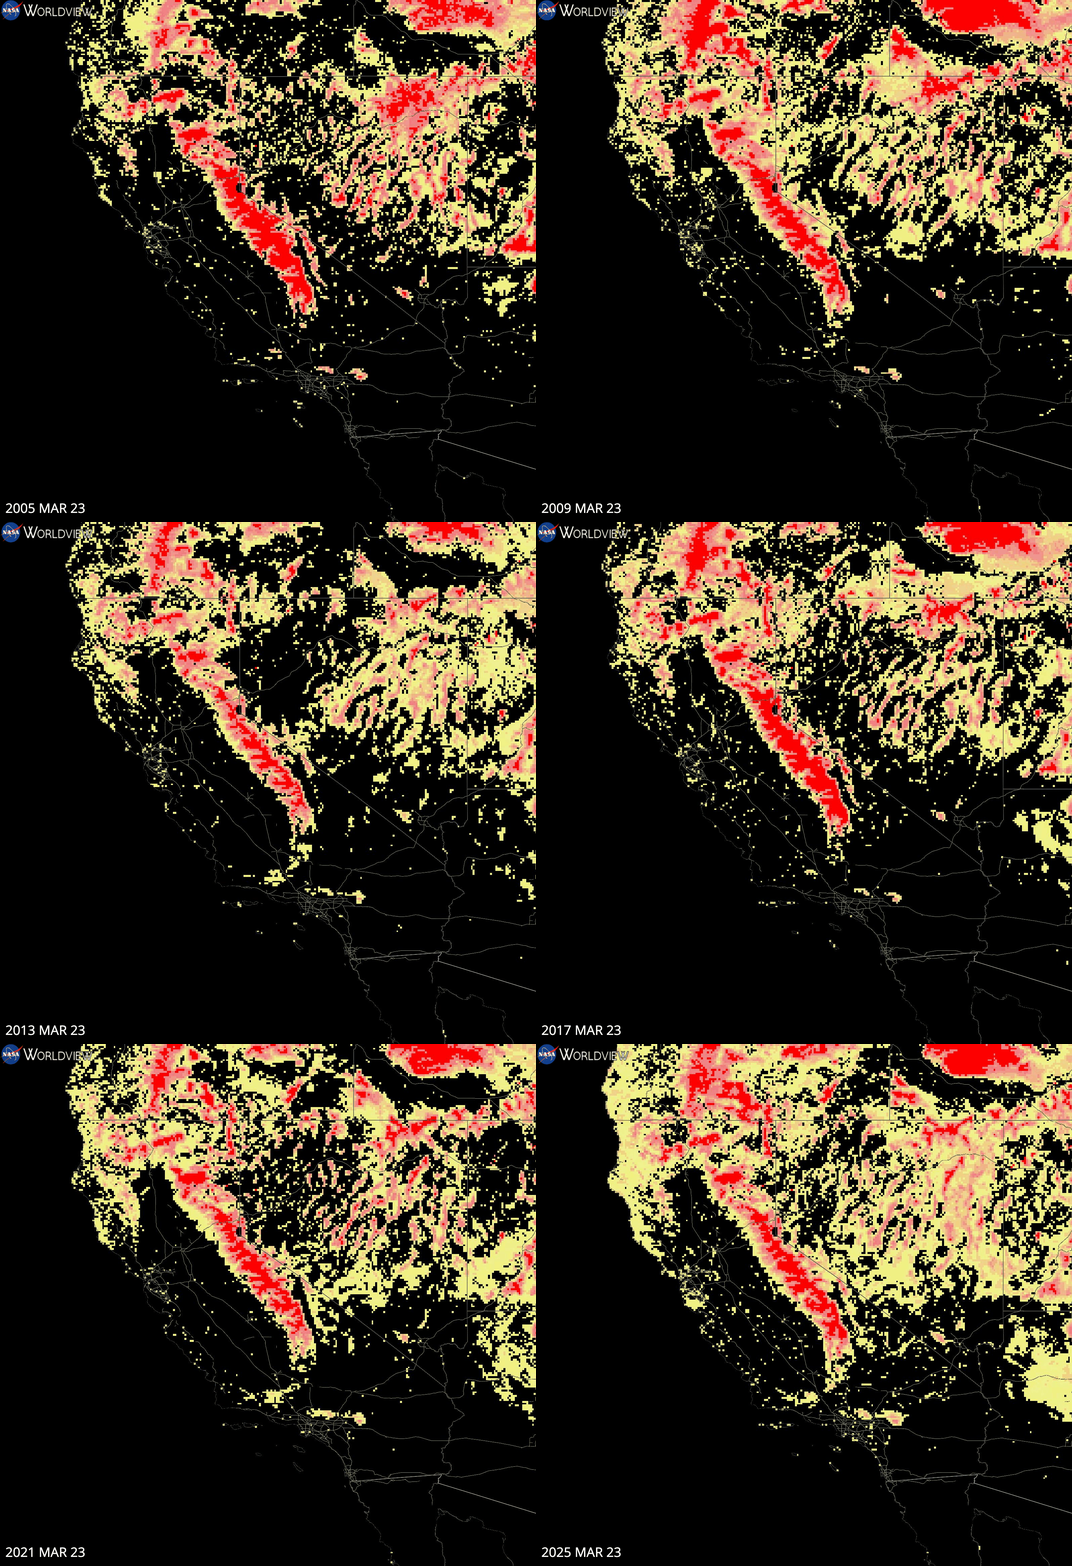
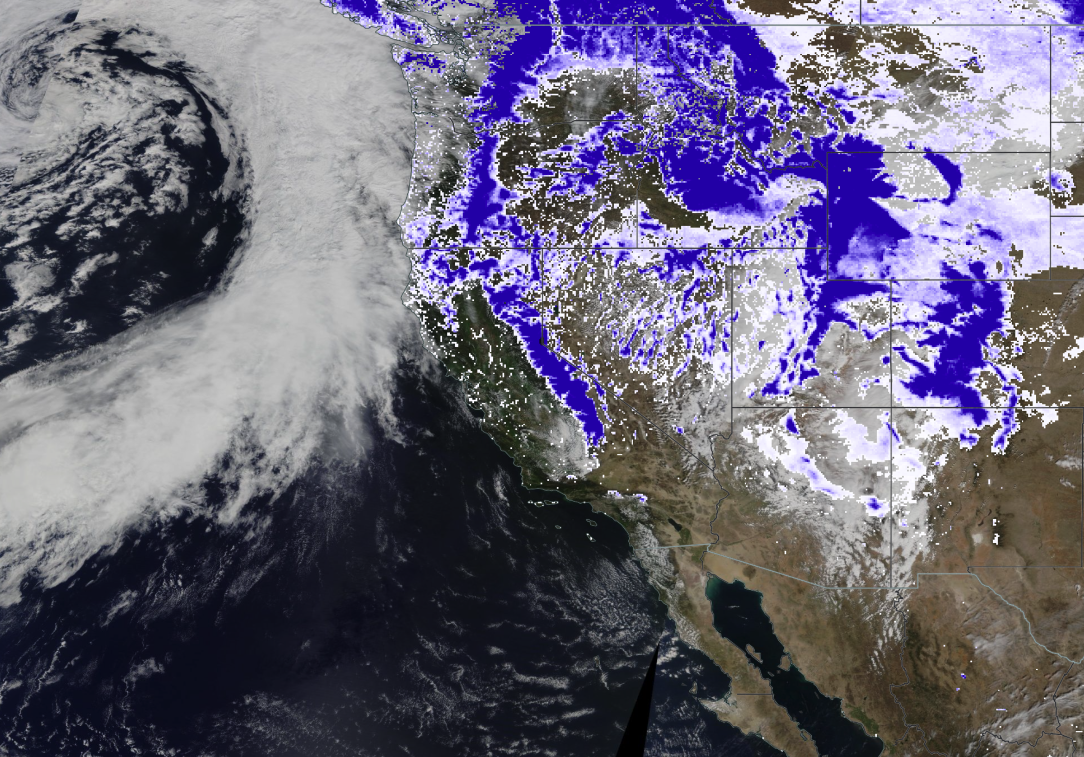
Note: In this animation, snowpack is highlighted in red and yellow for maximum contrast, with deeper reds indicating denser snow. While the header image of this article and interactive NASA tool below both use blue and white, all three visualizations reflect the same underlying snowpack measurements, rendered in different palettes for clarity.
Historical Context: California's Snowpack 2005–2025
Using data from the Echo Peak SNOTEL station (at an elevation of 7,650 feet), managed by the USDA Natural Resources Conservation Service, we see significant year-to-year variability that has critical implications for California’s water supply.
| Year | Jan SWE (in) | Feb SWE (in) | Mar SWE (in) | Apr SWE (in) (Peak Month) | May SWE (in) | Jun SWE (in) |
|---|---|---|---|---|---|---|
| 2005 | 25.6 | 39.4 | 49.0 | 59.9 | 51.1 | 14.3 |
| 2006 | 22.3 | 35.3 | 38.5 | 56.3 | 55.6 | 10.0 |
| 2007 | 7.3 | 9.7 | 24.9 | 18.1 | 4.4 | 0.0 |
| 2008 | 7.7 | 28.9 | 39.5 | 36.3 | 17.1 | 0.0 |
| 2009 | 12.7 | 16.4 | 26.7 | 34.2 | 17.6 | 0.0 |
| 2010 | 12.2 | 22.6 | 29.7 | 34.9 | 34.9 | 16.7 |
| 2011 | 31.2 | 36.0 | 48.1 | 67.5 | 61.3 | 40.9 |
| 2012 | 1.1 | 6.1 | 10.3 | 23.7 | 10.1 | 0.0 |
| 2013 | 29.5 | 29.0 | 29.1 | 24.7 | 1.8 | 0.0 |
| 2014 | 4.0 | 6.1 | 20.8 | 23.5 | 7.1 | 0.0 |
| 2015 | 7.1 | 7.0 | 10.3 | 0.0 | 0.0 | 0.0 |
| 2016 | 20.8 | 37.6 | 37.5 | 43.3 | 25.9 | 0.0 |
| 2017 | 11.4 | 44.4 | 72.0 | 74.5 | 70.8 | 25.7 |
| 2018 | 4.9 | 11.3 | 13.2 | 26.0 | 7.5 | 0.0 |
| 2019 | 11.1 | 26.4 | 57.1 | 71.3 | 45.7 | 24.1 |
| 2020 | 15.5 | 19.3 | 18.1 | 26.0 | 9.7 | 0.0 |
| 2021 | 11.7 | 19.8 | 27.5 | 30.0 | 3.8 | 0.0 |
| 2022 | 27.4 | 27.7 | 29.5 | 18.8 | 11.5 | 0.0 |
| 2023 | 31.0 | 48.4 | 63.3 | 89.8 | 67.0 | 27.3 |
| 2024 | 4.6 | 14.4 | 28.0 | 41.1 | 19.9 | 0.0 |
| 2025 | 16.7 | 20.3 | 31.3 | 40.0 | — | — |
Notable Snowpack Years (Snow Water Equivalent - SWE)
- 2005: Exceptional snow year, with peak snow water equivalent reaching approximately 60 inches in April, ensuring ample water resources.
- 2011: Another high-water year, with SWE peaking near 68 inches, one of the deepest snowpacks within this 20-year window.
- 2015: Record low snowpack, essentially negligible by early April, reflecting California’s severe drought conditions.
- 2017: Significant rebound year with snowpack peaking near 75 inches, dramatically alleviating drought conditions.
- 2023: Remarkably wet year, peaking at nearly 90 inches, marking one of the highest snowpacks in recent decades and underscoring the state's extreme weather fluctuations.
This wide variation underlines the volatile nature of California’s climate, where dramatic shifts from drought to surplus have profound implications for water management, agriculture, and wildfire risk.
Understanding the Impact
The snowpack serves as California’s natural water storage system, melting gradually in spring and summer to supply water for drinking, agriculture, and ecosystems. Years with abundant snowpack buffer the state against drought, while low snowpack years significantly increase water stress, heighten wildfire risks, and complicate water management.
Explore the interactive NASA Worldview map above to examine snowpack conditions year-by-year, seeing firsthand the rapid and drastic changes California experienced.
The Bigger Picture: Climate Change and Snowpack Trends
Climate researchers emphasize that these extremes are likely to intensify with climate change, potentially reducing average snowpack and increasing its variability.
California’s snowpack story over these two decades isn’t just about fluctuating snowfall; it symbolizes broader climate challenges that demand proactive adaptation and strategic water resource management moving forward.


