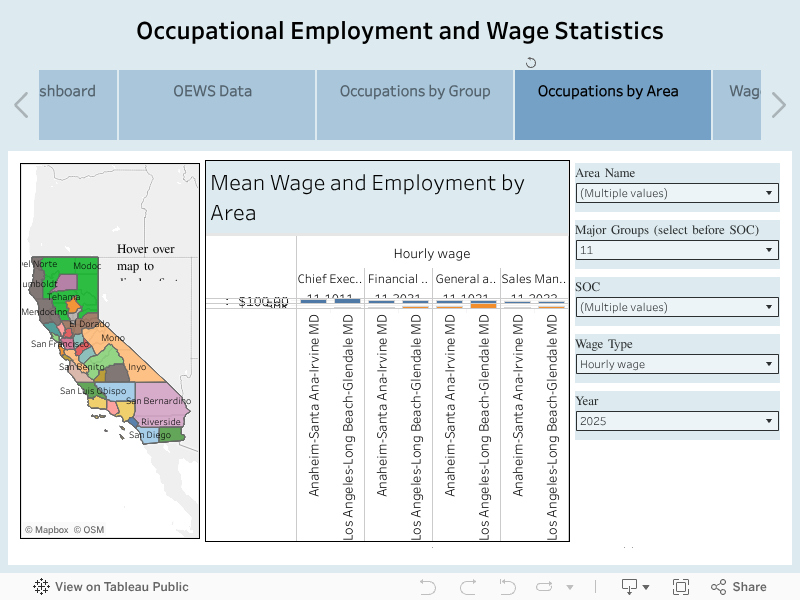
This interactive dashboard displays Occupational Employment and Wage Statistics (OEWS) for California, combining data from the U.S. Bureau of Labor Statistics (BLS) and the California Labor Market Information Division (LMID). It provides up-to-date insights into employment levels and wage estimates for hundreds of occupations across a wide range of industries and regions.
Key features:
- View mean and median wages for specific occupations
- Filter data by geographic area, industry group, or occupation
- See wage percentiles and relative standard errors
- Understand trends across metropolitan and non-metropolitan regions in California
Note: Estimates represent a snapshot in time and should not be used for trend analysis. Some fields may appear blank due to confidentiality or limited data availability.
For best results, use the full-screen option in the bottom right corner of the dashboard. If you're using filters, select the Area Type first before selecting an Area Name, and choose a Major Group before filtering by SOC (Standard Occupational Classification) codes.
Related:
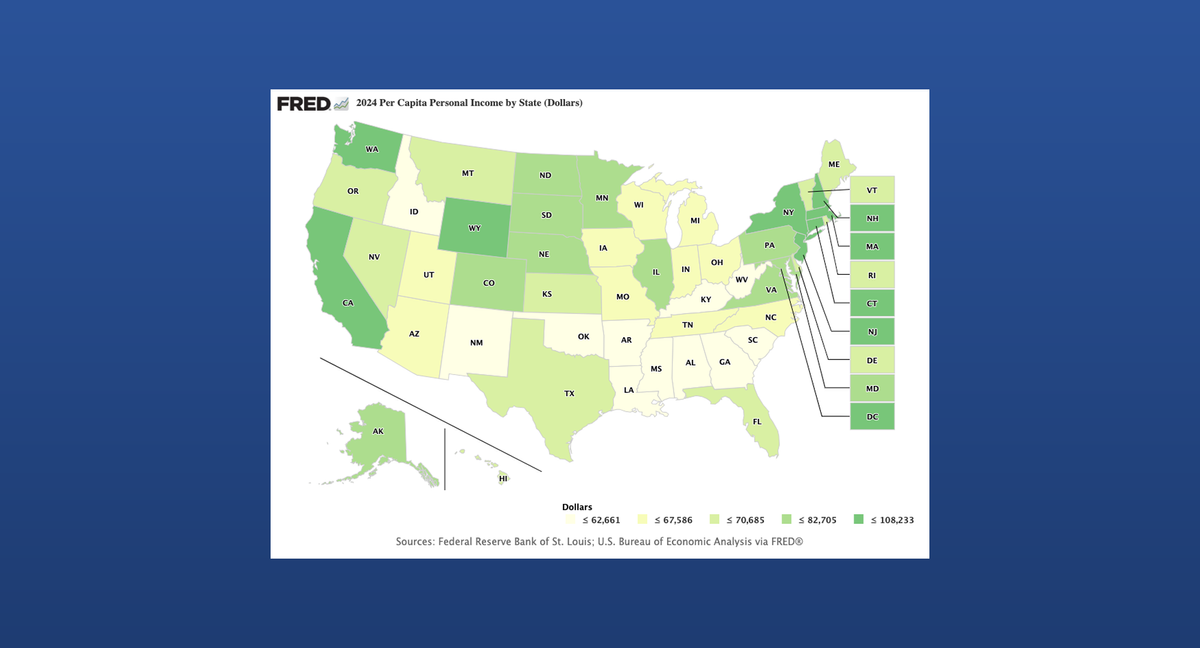
Per Capita Income by State: Explore U.S. Rankings with Interactive Map
Compare per capita income across all 50 U.S. states using a live, interactive map updated with the latest federal data. This tool offers a clear view of how income levels differ by region and where each state falls within national income tiers.
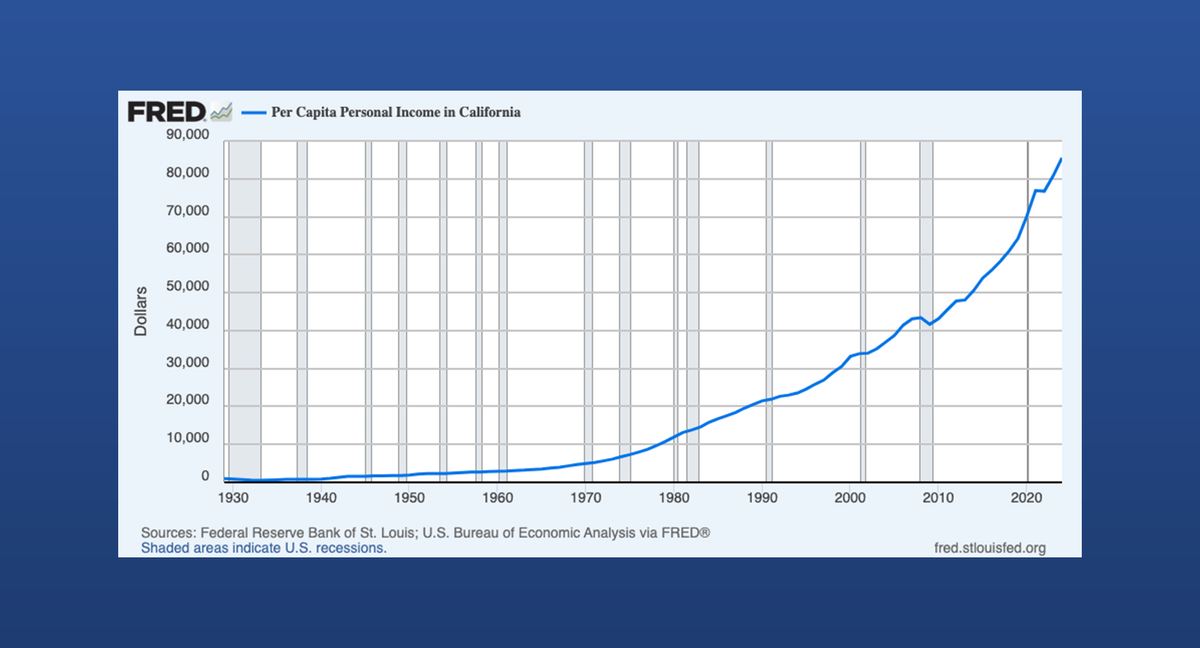
California Per Capita Income: Historical Trends and Data Revisions
California’s per capita personal income has steadily increased over time, reflecting long-term economic shifts across the state. This page features interactive charts with historical data and revisions, updated automatically as new federal estimates are released.
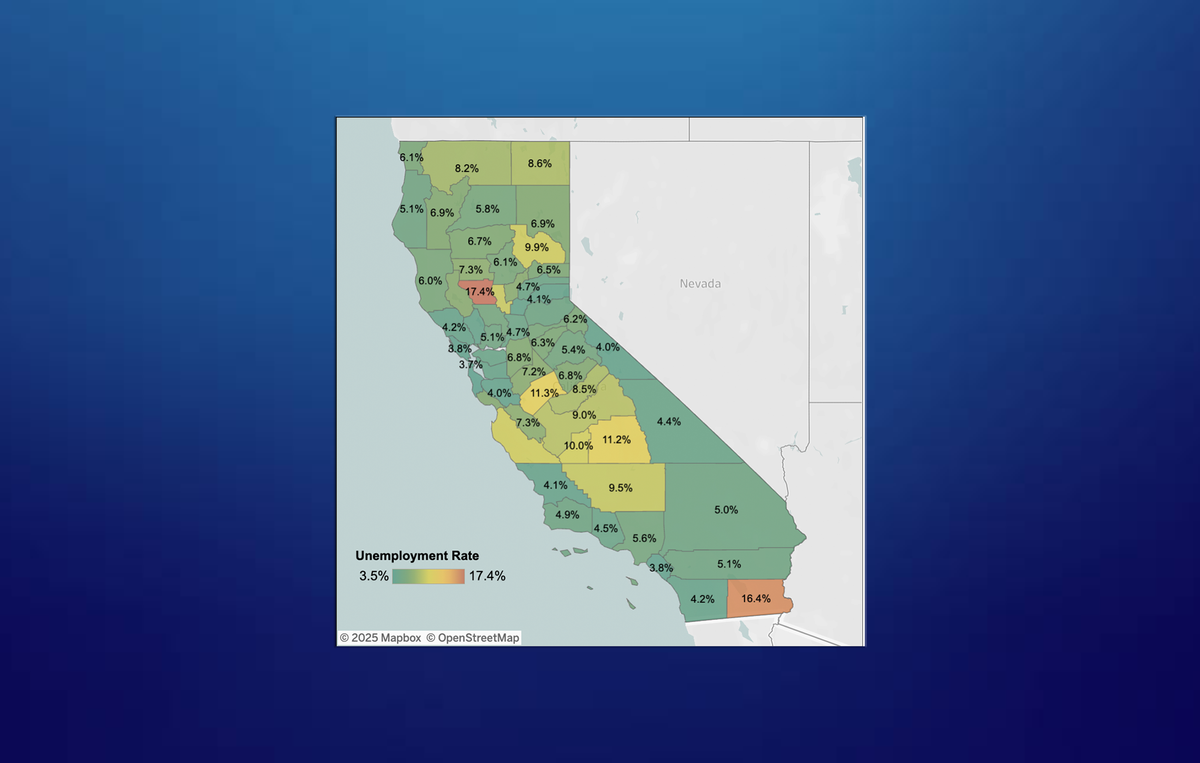
California Unemployment Map and Labor Force Data
Explore California’s unemployment rate by county with this interactive map, plus current labor force metrics. Updated monthly with data from the EDD and U.S. Bureau of Labor Statistics.