California’s production workers earn below U.S. average, new federal data reveals
New BLS data released for May 2025 shows California’s production workers earn less than the U.S. average, with key wage percentiles and employment rates now updated statewide.

California’s 107,090 production workers earn less than the national average, according to new federal labor data released in May 2025.
The U.S. Bureau of Labor Statistics (BLS) reported that California’s annual mean wage for production occupations was $48,680, compared to the national average of $50,090. These workers made up 5.93 out of every 1,000 jobs statewide, with a location quotient of 0.63—suggesting California employs fewer production workers per capita than the national norm.
California Production Worker Pay: May 2025 Snapshot
| Wage Metric | Value |
|---|---|
| Hourly Mean Wage | $23.40 |
| Annual Mean Wage | $48,680 |
| Hourly Median Wage | $22.14 |
| Hourly 10th–90th Percentile Range | $17.20 – $31.04 |
| Annual 10th–90th Percentile Range | $35,780 – $64,570 |
While the 10th percentile annual wage was $35,780, top earners in the 90th percentile made $64,570. California’s production workforce includes machinists, plant operators, assemblers, quality testers, welders, and other roles essential to manufacturing and industrial supply chains.
These figures reflect full-time annualized earnings and exclude self-employed or informal workers.
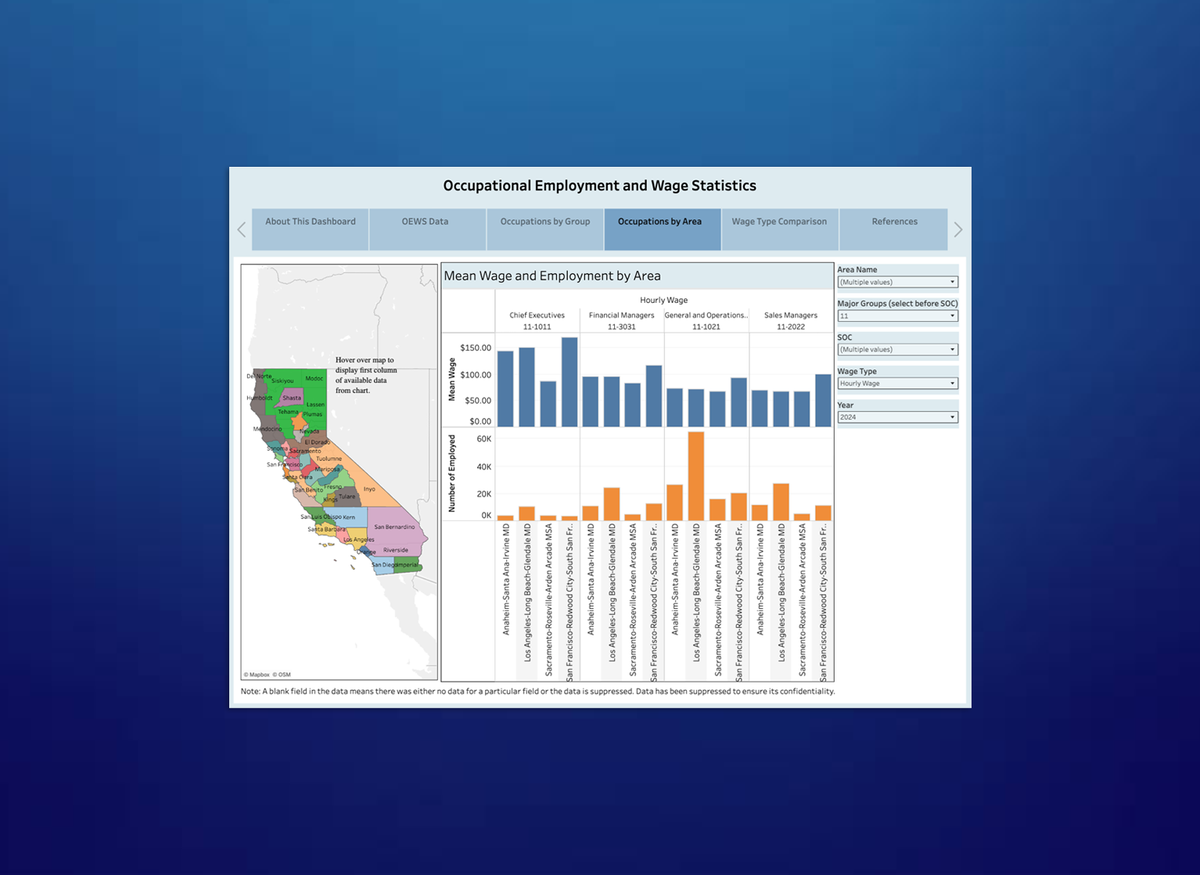
You can explore a full breakdown by occupation and region using our California Occupational Wages and Employment Dashboard.
National Context: Production Jobs Still Pay Less Than Average
Nationally, production occupations accounted for 5.7% of all jobs in May 2024—roughly 8.7 million positions. The highest-paid roles in this category included nuclear power reactor operators ($122,830) and power distributors and dispatchers ($109,620), while the lowest earners were concentrated in apparel and textile work, often earning less than $34,000 annually.
California’s overall production wages remain slightly below this national mean, echoing wage trends in states with higher costs of living but more diversified economies. By contrast, states like Indiana and Wisconsin had much higher employment concentrations in production occupations—11.3% and 10.5% respectively.
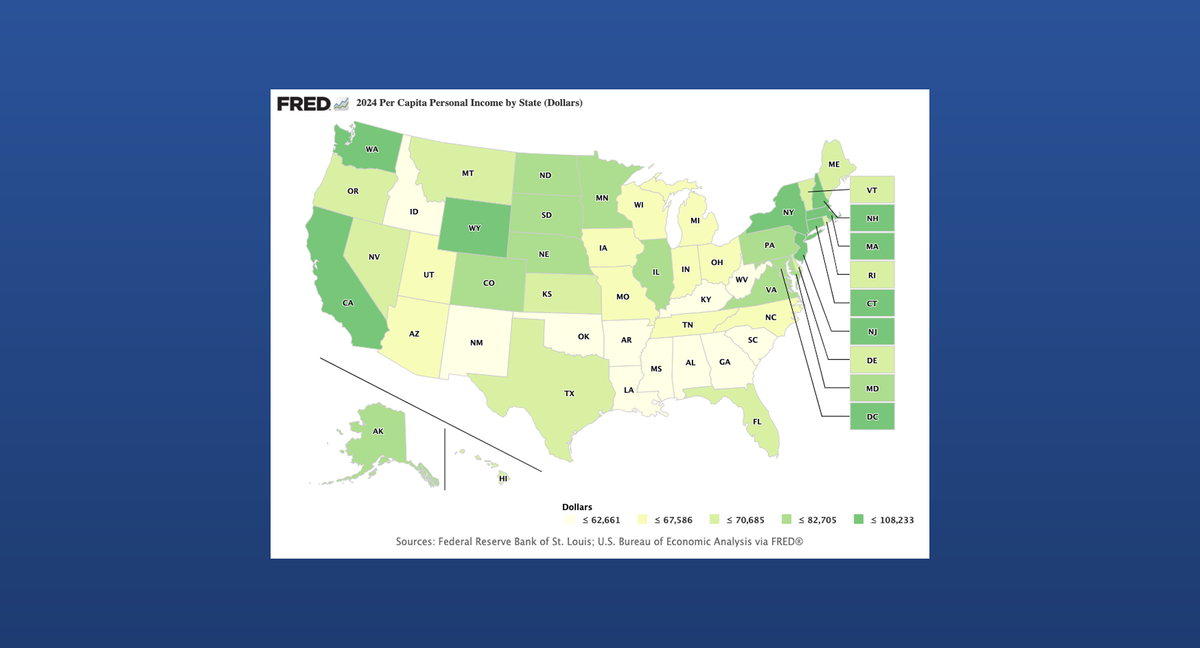
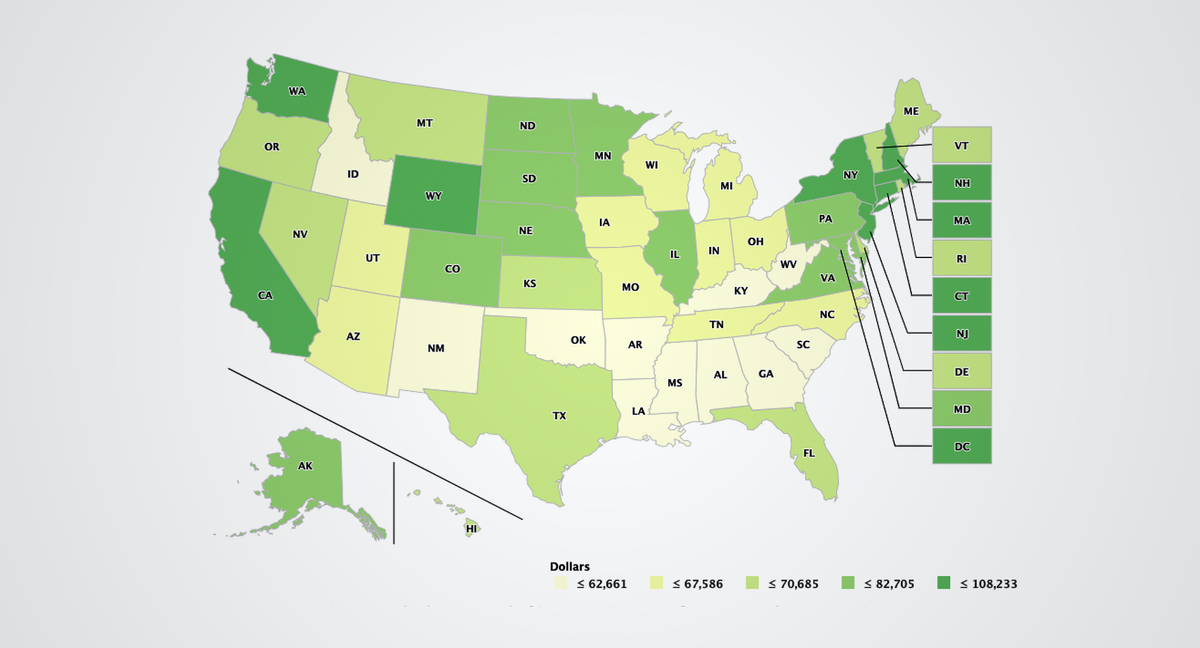
California's broader income and employment standing compared to other states can be explored in our state rankings dashboard.
More Than Just Manufacturing
The OEWS (Occupational Employment and Wage Statistics) program also highlighted architecture and engineering, as well as building and grounds maintenance occupations in the national release. Though California data for these groups is pending full integration into the BLS OEWS platform, the national figures are telling:
- Architecture and Engineering Occupations: $103,980 average wage across 2.6 million jobs.
- Building and Grounds Maintenance: $39,540 average wage across 4.5 million jobs.
California’s unique economy—shaped by high-tech industry, climate policy, and land-use patterns—means that its labor market shares more in common with states like Massachusetts than with Rust Belt states still dominated by manufacturing.
California's broader income and employment standing compared to other states can be explored in our state rankings dashboard.
What’s New in the 2024–2025 BLS Update?
This latest OEWS release includes updated metropolitan area definitions based on the 2020 Census, affecting how labor markets are reported at the local level. While most states were included, Colorado’s substate data was excluded due to previously reported issues with unemployment insurance system modernization, though national figures may be marginally affected.
California-specific breakdowns by metro area and industry will be published incrementally at www.bls.gov/oes/current/oessrcst.htm, as the BLS continues rolling out the updated 2025 datasets.
What to Read Next