Use the tools below to explore the most up-to-date snapshot of California's labor market.
- The interactive map shows county-by-county unemployment rates across the state.
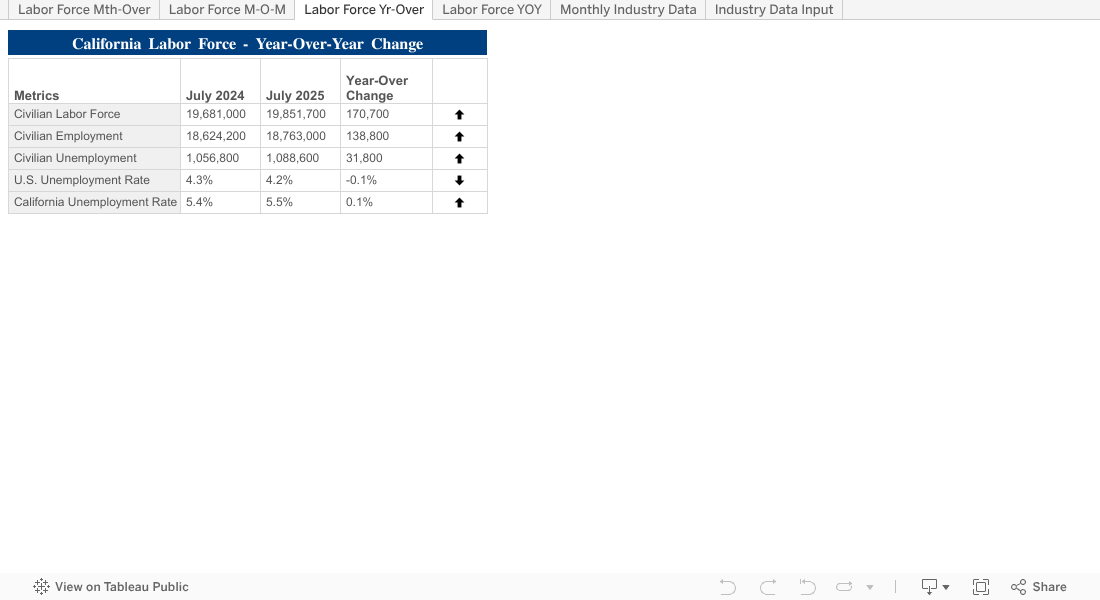
- The labor force charts reveal both month-over-month and year-over-year changes in employment, unemployment, and labor force size.
These tools are updated monthly using data from the California Employment Development Department (EDD) and the U.S. Bureau of Labor Statistics (BLS).
California County Unemployment Map
This interactive map shows unemployment rates across all 58 counties in California.
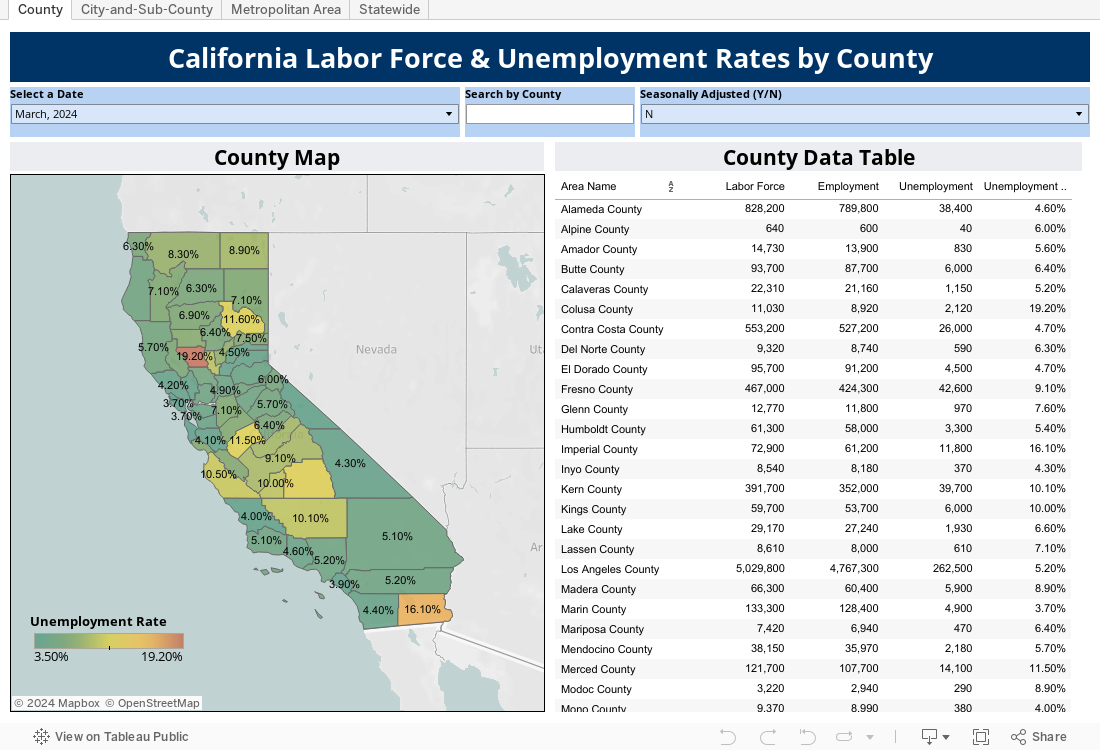
Click on a county to view specific data, or use the toolbar to explore trends across regions.
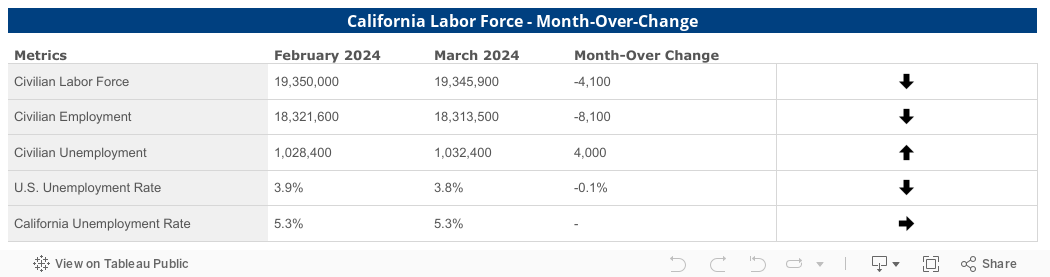
Labor Force Metrics: Month-over-Month and Year-over-Year
These two tables compare California’s labor force stats. Key metrics include:
- Civilian labor force size
- Employment and unemployment totals
- Unemployment rates in California and the U.S.
Conclusion
Understanding how employment trends shift over time — and from county to county — is essential for employers, policymakers, and job seekers. This resource offers a consistent and visual way to track changes in California’s labor force and unemployment landscape, with fresh data every month.
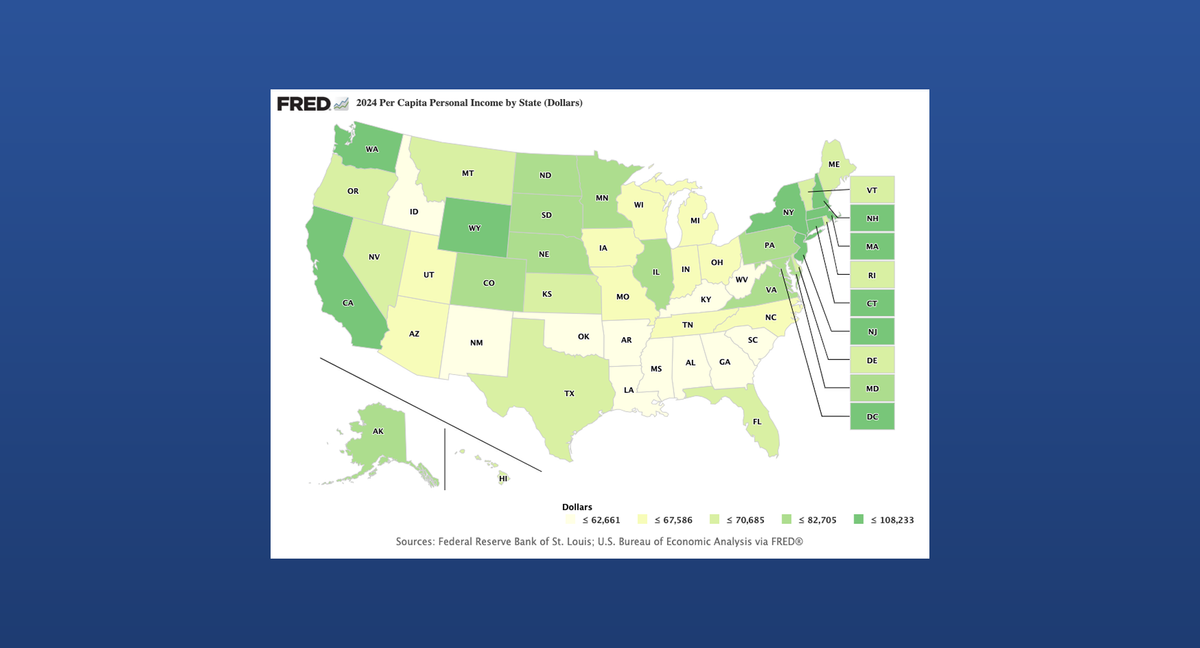
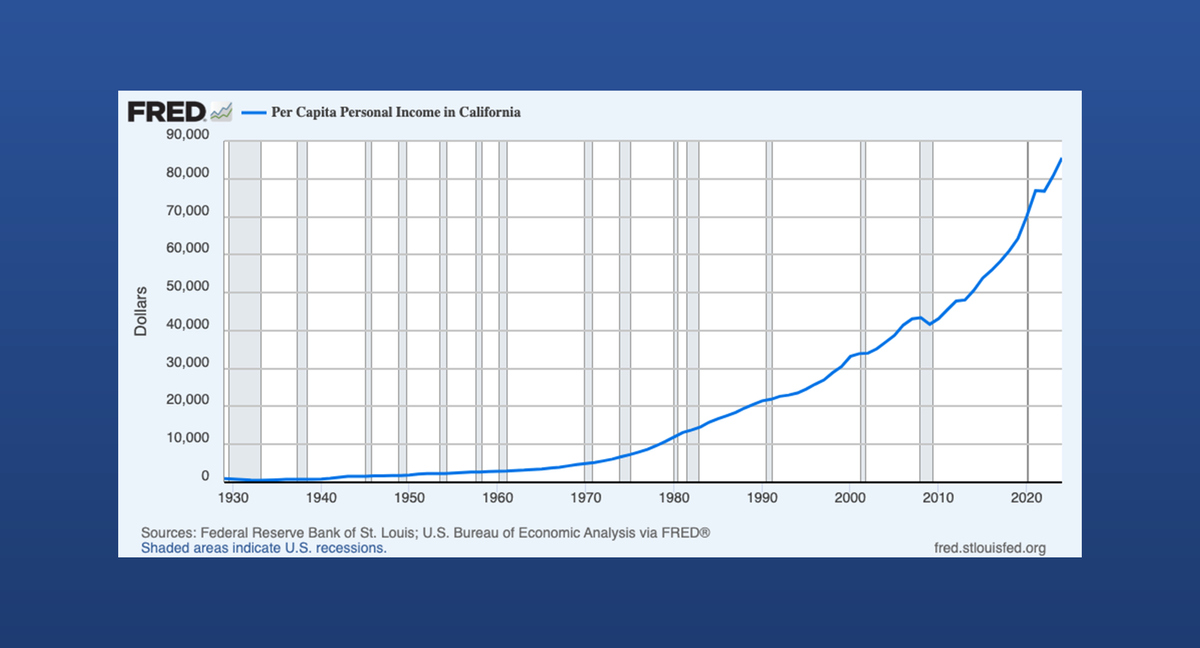
Related California Employment and Income Data