
Analyzing Regional Water Trends with the USGS Area-Based Streamflow Map
Rather than focusing on single points, this USGS tool averages data across Hydrologic Units (HUCs) to provide a broader regional perspective. It is essential for understanding water distribution across entire drainage basins, offering views on daily, 7-day, or monthly averages.
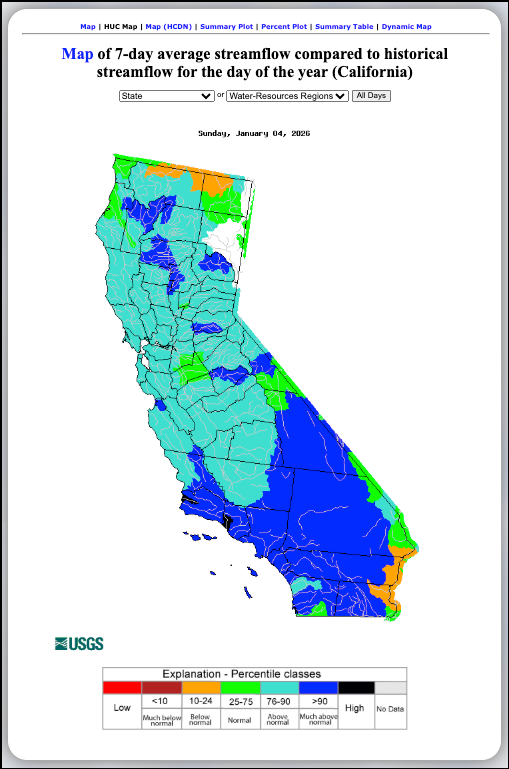
The USGS Area-based Streamflow Map (referred to as the HUC-based map on the dashboard) provides a regional perspective on water conditions by averaging data across specific geographic areas known as Hydrologic Units.
Key Features and Functionality
- Regional Averaging: Unlike the State Map which shows individual points, this tool color-codes entire drainage basins (HUCs) to show broader regional trends.
- Averaging Periods: While the provided image shows a 7-day average, this tool can also display daily, 14-day, 28-day, and monthly average streamflows.
- Historical Comparison: It compares the chosen average (e.g., the last 7 days) against the historical record for that same period of the year.
- Navigation & View Options:
- Filters: Users can toggle between different states or "Water-Resources Regions" and select different time durations using the "All Days" dropdown.
- Additional Data Views: Links at the top of the tool allow users to switch to a Summary Plot, Percent Plot, Summary Table, or an interactive Dynamic Map for the same data.
Understanding the Area-based Legend
The map uses a standardized color scale based on percentile classes to indicate how current regional conditions compare to history:
- Black: High
- Dark Blue (>90): Much above normal
- Light Blue (76–90): Above normal
- Green (25–75): Normal
- Orange (10–24): Below normal
- Dark Red (<10): Much below normal
- Red: Low
- Grey: No Data
Learn More About Tracking California Water Levels
Use the guides below to navigate the various tools and data visualizations provided by the USGS. These resources are designed to help you interpret real-time streamflow maps, historical runoff comparisons, and regional water conditions across California.
- USGS California Streamflow Map
- USGS California Comparison of Streamflow Maps
- USGS California Streamflow Summary
- USGS California Cumulative Runoff Hydrograph
- USGS California Duration Hydrograph
- USGS California Cumulative Percent Summary
- USGS California Regional Class Summary
- USGS California Area-Based Streamflow Map
- USGS California Streamflow Conditions Map