
Monitoring Yearly Water Totals with the USGS Cumulative Runoff Hydrograph
This tool tracks the total volume of water accumulated over a Water Year or Calendar Year. The USGS compares the current year’s cumulative runoff against historical extremes (like the record lows of 1977 and highs of 1983) to determine if a season is trending wet or dry.
The USGS Cumulative Runoff Hydrograph (created using the USGS Cumulative Area-Based Runoff Hydrograph Builder) tracks the total accumulation of runoff over a specific time period, such as a Water Year, and compares it to historical extremes and averages.
Key Features and Functionality
- Cumulative Tracking: Unlike standard hydrographs that show daily rates, this tool sums up the runoff over time, providing a clear picture of total water volume accumulated since the start of the tracking period.
- Customizable Parameters:
- Timeframe: Users can select the specific Year to view (e.g., 2026).
- Year Type: The tool can plot data based on the Water Year (beginning in October) or the Calendar Year.
- Data Averaging: Users can choose the Runoff type, such as a 7-day average.
- Visual Scaling: The Y-axis can be set to a Log10 scale to better visualize a wide range of runoff values.
- Historical Benchmarks: The plot automatically includes lines representing the years with the lowest (e.g., 1977) and highest (e.g., 1983) observed cumulative runoff for direct comparison.
- Data Caveat: A warning indicates that area-based runoff may be calculated from a mix of regulated and unregulated streamflows, which can impact the depiction of flow conditions.
Understanding the Cumulative Hydrograph
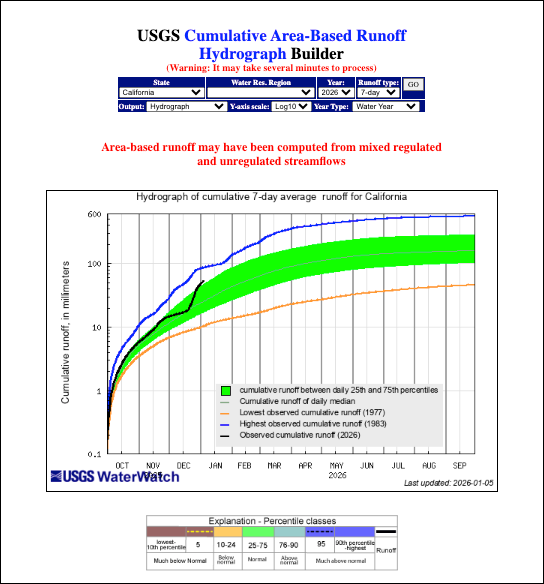
The graph plots the total accumulated runoff (in millimeters) on the vertical y-axis against the months of the selected year on the horizontal x-axis.
- Observed Cumulative Runoff (Solid Black Line): This shows the actual total runoff accumulated so far in the current year (e.g., 2026).
- Normal Range (Green Shaded Area): Represents the range between the 25th and 75th percentiles of historical daily cumulative runoff.
- Historical Median (Green Line): A thin green line within the shaded area represents the historical daily median cumulative runoff.
- Historical Extremes:
- Blue Line: Represents the year with the highest observed cumulative runoff on record.
- Orange Line: Represents the year with the lowest observed cumulative runoff on record.
By observing where the black line sits relative to the shaded green area and the extreme blue/orange lines, users can determine if the current year is exceptionally wet, dry, or within the normal historical range.
Learn More About Tracking California Water Levels
Use the guides below to navigate the various tools and data visualizations provided by the USGS. These resources are designed to help you interpret real-time streamflow maps, historical runoff comparisons, and regional water conditions across California.
- USGS California Streamflow Map
- USGS California Comparison of Streamflow Maps
- USGS California Streamflow Summary
- USGS California Cumulative Runoff Hydrograph
- USGS California Duration Hydrograph
- USGS California Cumulative Percent Summary
- USGS California Regional Class Summary
- USGS California Area-Based Streamflow Map
- USGS California Streamflow Conditions Map