Water Data at a Glance: The USGS California Regional Class Summary Table
This tool provides a granular, day-by-day breakdown of hydrological conditions across the state's gage network. The USGS summarizes the percentage of stations in each percentile class, offering a precise numerical count of current water status from "Low" to "High".
The USGS Regional Class Summary (referred to as the Summary Table on the USGS dashboard) provides a breakdown of how hydrological conditions have been distributed across California's streamgages.
Key Features and Functionality
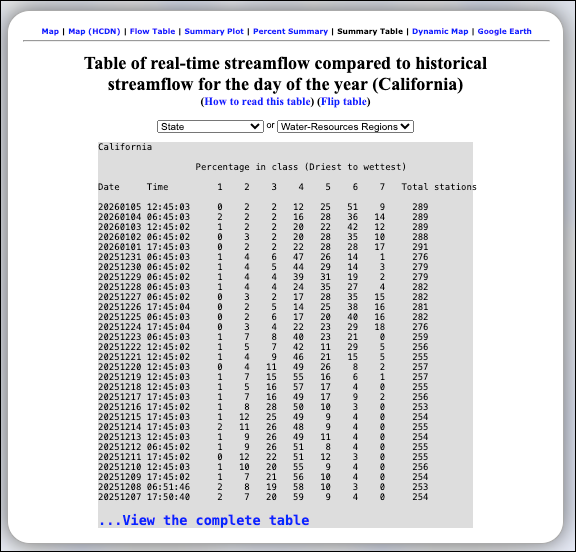
- Daily Distribution Tracking: This tool displays the percentage of streamgages falling into each of the seven percentile classes for every day, providing a granular look at how the state's water status is shifting.
- Driest to Wettest Scale: The table uses a numerical scale (1 through 7) to categorize flow conditions:
- 1: Low
- 2: Much below normal (<10 percentile)
- 3: Below normal (10–24 percentile)
- 4: Normal (25–75 percentile)
- 5: Above normal (76–90 percentile)
- 6: Much above normal (>90 percentile)
- 7: High
- Station Integrity: For each date and time listed, the table includes the Total stations used in the calculation, allowing users to see how the active gage network fluctuates (e.g., approximately 253 to 291 sites).
- Customization Options: Users can utilize dropdown menus to change the view from the entire State to specific Water-Resources Regions.
- Navigation & Utilities: The page includes a "Flip table" option to reverse the chronological order and a "How to read this table" guide for additional clarity. Quick links at the top allow for easy switching between other visual tools like the Map, Flow Table, or Summary Plot.
Understanding the Data
By reading across a single row, a user can determine the exact proportion of the state experiencing specific conditions on that date. For example, on January 5, 2026, 51% of the reporting stations were in class 6 ("Much above normal"), while 12% were in class 4 ("Normal").
Learn More About Tracking California Water Levels
Use the guides below to navigate the various tools and data visualizations provided by the USGS. These resources are designed to help you interpret real-time streamflow maps, historical runoff comparisons, and regional water conditions across California.
- USGS California Streamflow Map
- USGS California Comparison of Streamflow Maps
- USGS California Streamflow Summary
- USGS California Cumulative Runoff Hydrograph
- USGS California Duration Hydrograph
- USGS California Cumulative Percent Summary
- USGS California Regional Class Summary
- USGS California Area-Based Streamflow Map
- USGS California Streamflow Conditions Map