Navigating California’s Water Systems with the USGS Interactive State Map
The USGS WaterWatch Streamflow Map (identified as the State Map on the main dashboard) provides a visual representation of real-time streamflow compared to historical data for a specific day of the year.
Key Features and Functionality
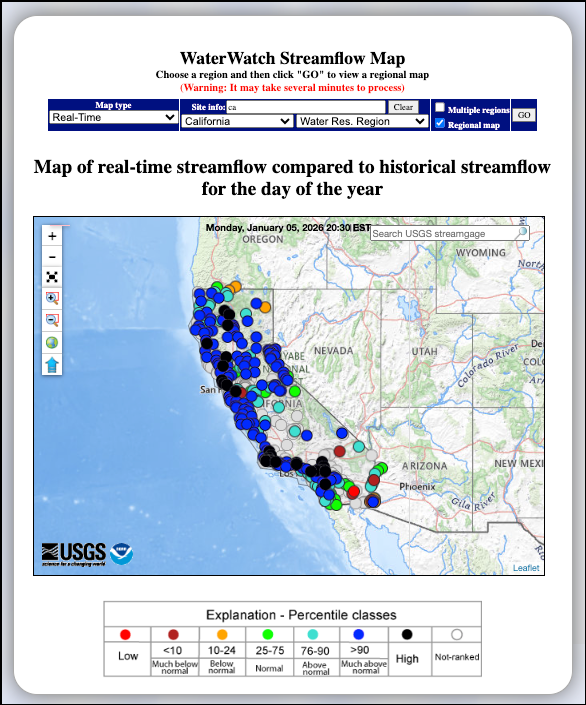
- Real-Time Data Comparison: The map displays streamgage locations across California, showing how current water levels compare to historical records for this date.
- Interactive Navigation: Users can click on any individual streamgage (colored dot) on the map to navigate to a dedicated page for that specific site.
- Search and Filter Tools:
- Map Type: A dropdown menu allows users to switch between different data views, such as "Real-Time".
- Region Selection: Users can filter the map by state (e.g., California) or by Water Resource Region.
- Search Box: A search bar at the top right of the map enables quick location of specific USGS streamgages.
- Zoom/Pan Controls: Standard map navigation tools are located on the left side of the map interface.
Understanding the Map Legend (Percentile Classes)
The streamgages are color-coded based on their flow percentiles, indicating how the current flow compares to historical norms:
- Black: High
- Dark Blue (>90): Much above normal
- Light Blue (76–90): Above normal
- Green (25–75): Normal
- Orange (10–24): Below normal
- Dark Red (<10): Much below normal
- Red: Low
- White Circle: Not-ranked
Learn More About Tracking California Water Levels
Use the guides below to navigate the various tools and data visualizations provided by the USGS. These resources are designed to help you interpret real-time streamflow maps, historical runoff comparisons, and regional water conditions across California.
- USGS California Streamflow Map
- USGS California Comparison of Streamflow Maps
- USGS California Streamflow Summary
- USGS California Cumulative Runoff Hydrograph
- USGS California Duration Hydrograph
- USGS California Cumulative Percent Summary
- USGS California Regional Class Summary
- USGS California Area-Based Streamflow Map
- USGS California Streamflow Conditions Map
How to track California water levels and flood risk with USGS data: Complete guide for 2026
Master the tools used by state officials to monitor California river levels. This 2026 guide explains how to interpret USGS WaterWatch data, including streamflow status and flood monitoring alerts, to help you understand the hydrological impact of recent atmospheric rivers.