The Public Input Data Dashboard provides a comprehensive record of all comments submitted to the California Citizens Redistricting Commission prior to the adoption of the Final Maps. This interactive tool organizes the raw input received from the public into tables, charts, graphs, and maps that make the scale and substance of participation easier to understand.
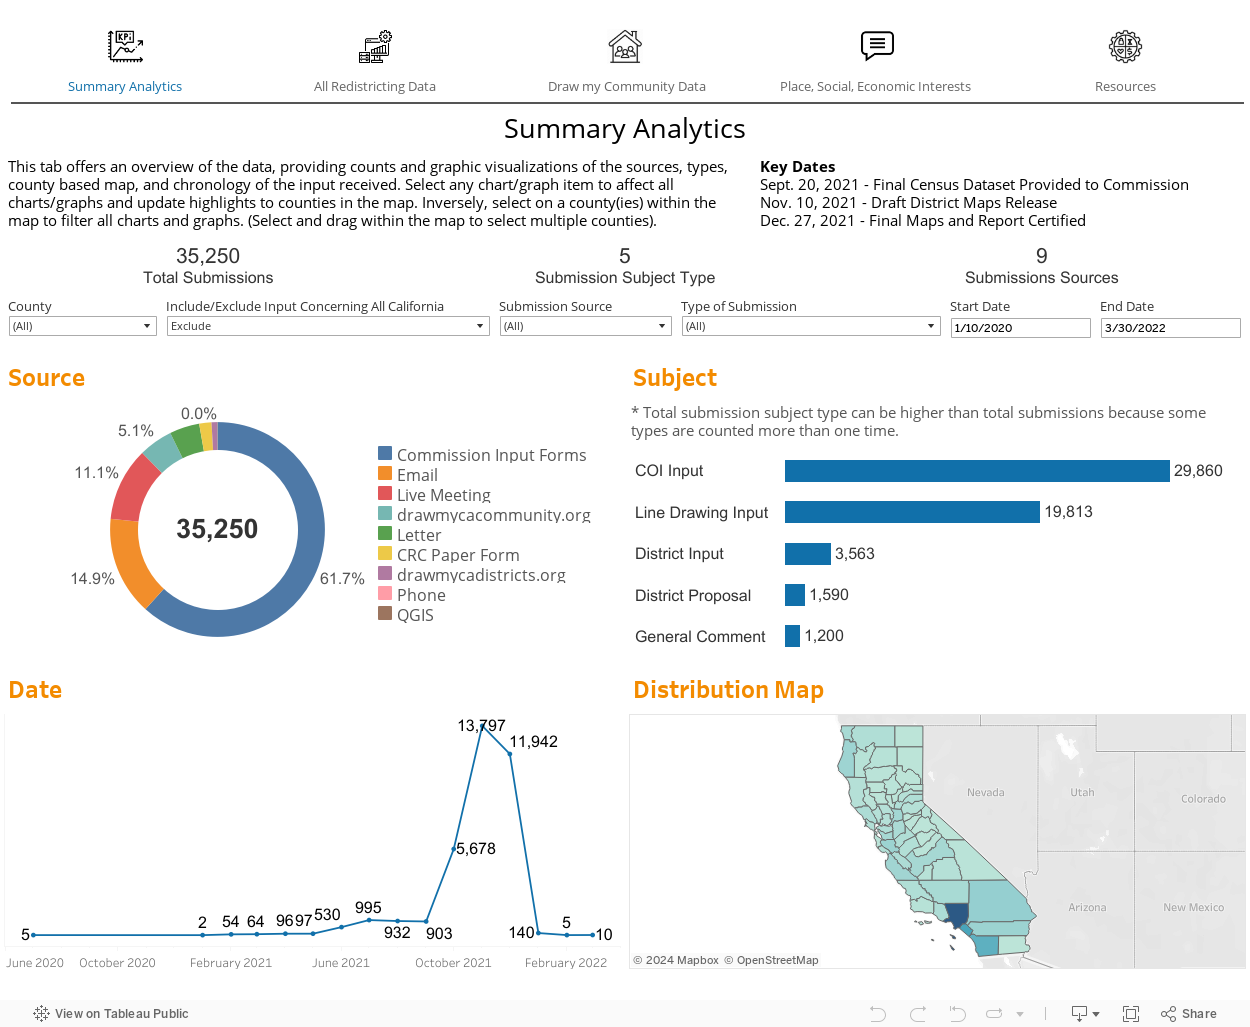
It’s important to note that the Summary Analytics, characterizations of interests, and other visualizations included here were created after the fact. During the 2020 redistricting process, the Commission only had access to the comments in their complete, unsorted form. The dashboard was developed to give Californians, researchers, and policymakers a clearer picture of how communities engaged in shaping new district boundaries, and to ensure transparency in how public input factored into the state’s redistricting process.