
Track California wage and employment data in 2025 with this interactive tool
This interactive dashboard tracks the latest occupational wage and employment data in California. View real-time trends by job, industry, and region.

The interactive California employment dashboard below offers detailed insights into wages and employment levels for hundreds of occupations across California.
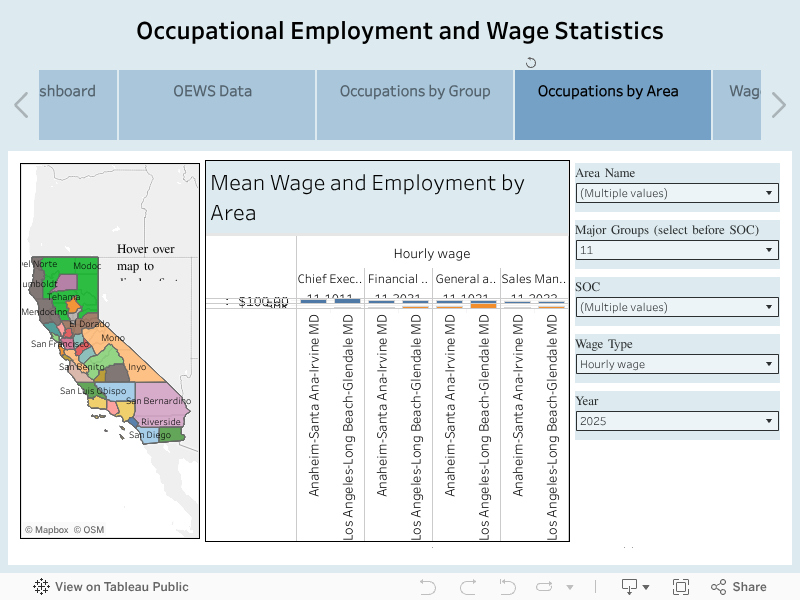
Built by the California Labor Market Information Division using U.S. Bureau of Labor Statistics data, the tool lets users view median and mean wages, employment counts, and wage percentiles across the state’s major metro and non-metro areas. Results can be filtered by region, industry group, or occupation.
The dashboard includes:
- Wage data for over 800 job titles
- Filters by geography, occupation, and industry
- Percentile wage ranges (10th, 25th, median, 75th, 90th)
- Built-in visualizations and exportable tables
The data reflects official Occupational Employment and Wage Statistics (OEWS) and is updated annually to capture changes in California’s dynamic labor market.
While the dashboard was created with economists and workforce planners in mind, it’s also highly accessible to students, job seekers, and journalists looking to understand how different roles are compensated across the state.


