As 2024 comes to a close, CA reservoir levels show mixed trends year-over-year
California’s water supply reservoirs have shown a variety of trends over the past year, reflecting the state’s ongoing battle with fluctuating water levels due to variable rainfall and water management challenges.


California’s water supply reservoirs have shown a variety of trends over the past year, reflecting the state’s ongoing battle with fluctuating water levels due to variable rainfall and water management challenges. Data released on November 23, 2024, reveals changes in water storage across key reservoirs compared to the same date from 2023.
While some reservoirs have seen significant improvements, others are struggling to maintain levels that meet historical averages, raising concerns about the upcoming winter’s potential to replenish supplies.
Positive Gains in Key Reservoirs
Some reservoirs, including Trinity, Sonoma, Casitas, and Diamond Valley, reported substantial increases in both their total capacity and historical averages. These gains indicate localized areas of improved water availability, possibly attributed to targeted conservation efforts and regional rainfall patterns over the last year.
Declines in Other Major Reservoirs
In contrast, key reservoirs such as Shasta, Oroville, and Folsom experienced sharp declines, with levels falling below both their total capacity and historical averages. These reservoirs play a crucial role in California’s water distribution system, serving millions of residents and large agricultural regions. Their decline underscores the need for ongoing water management strategies and highlights the unpredictability of the state’s hydrology.
Major Changes in Reservoir Levels (2023 vs. 2024)
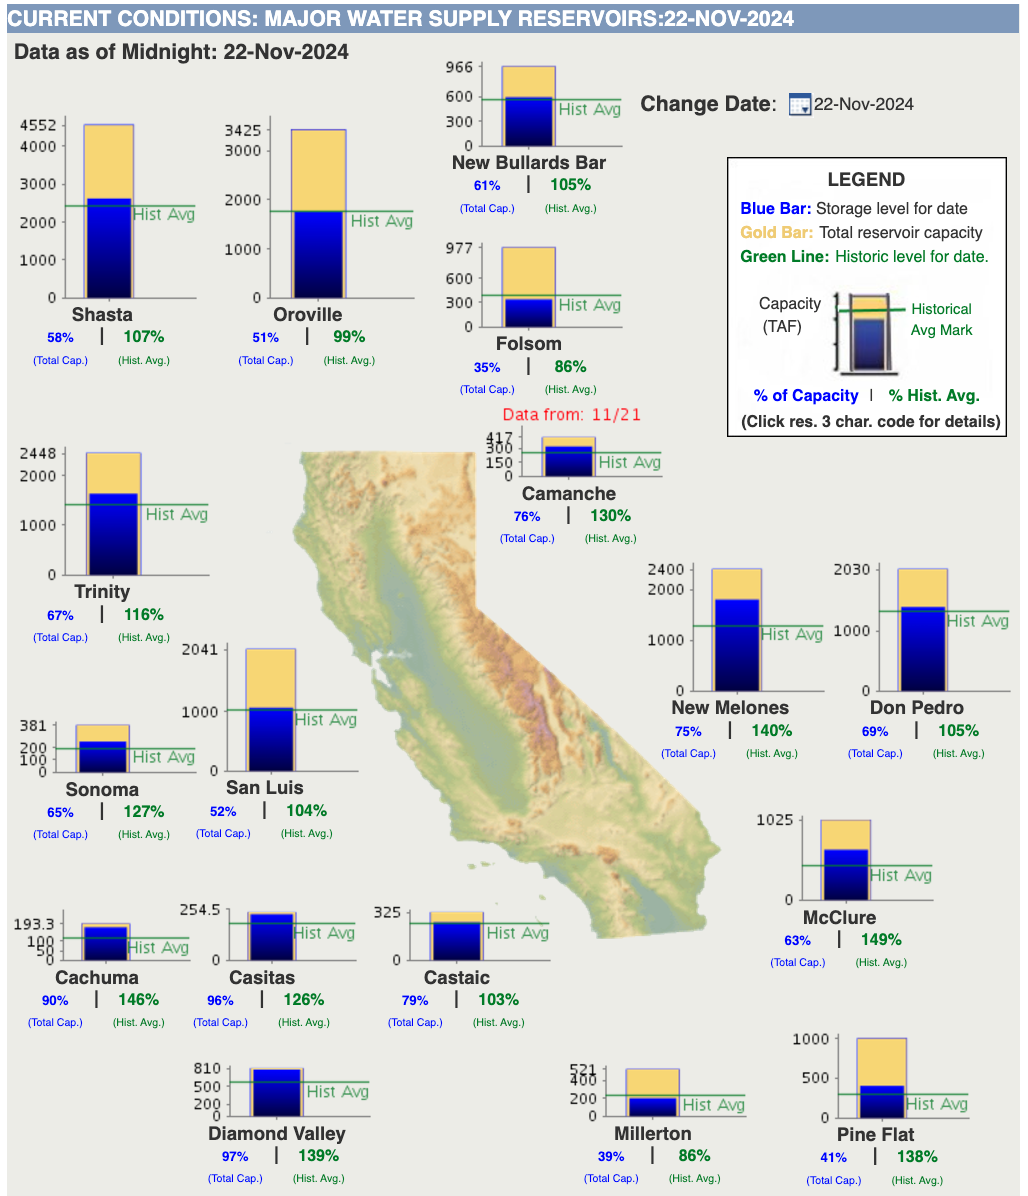
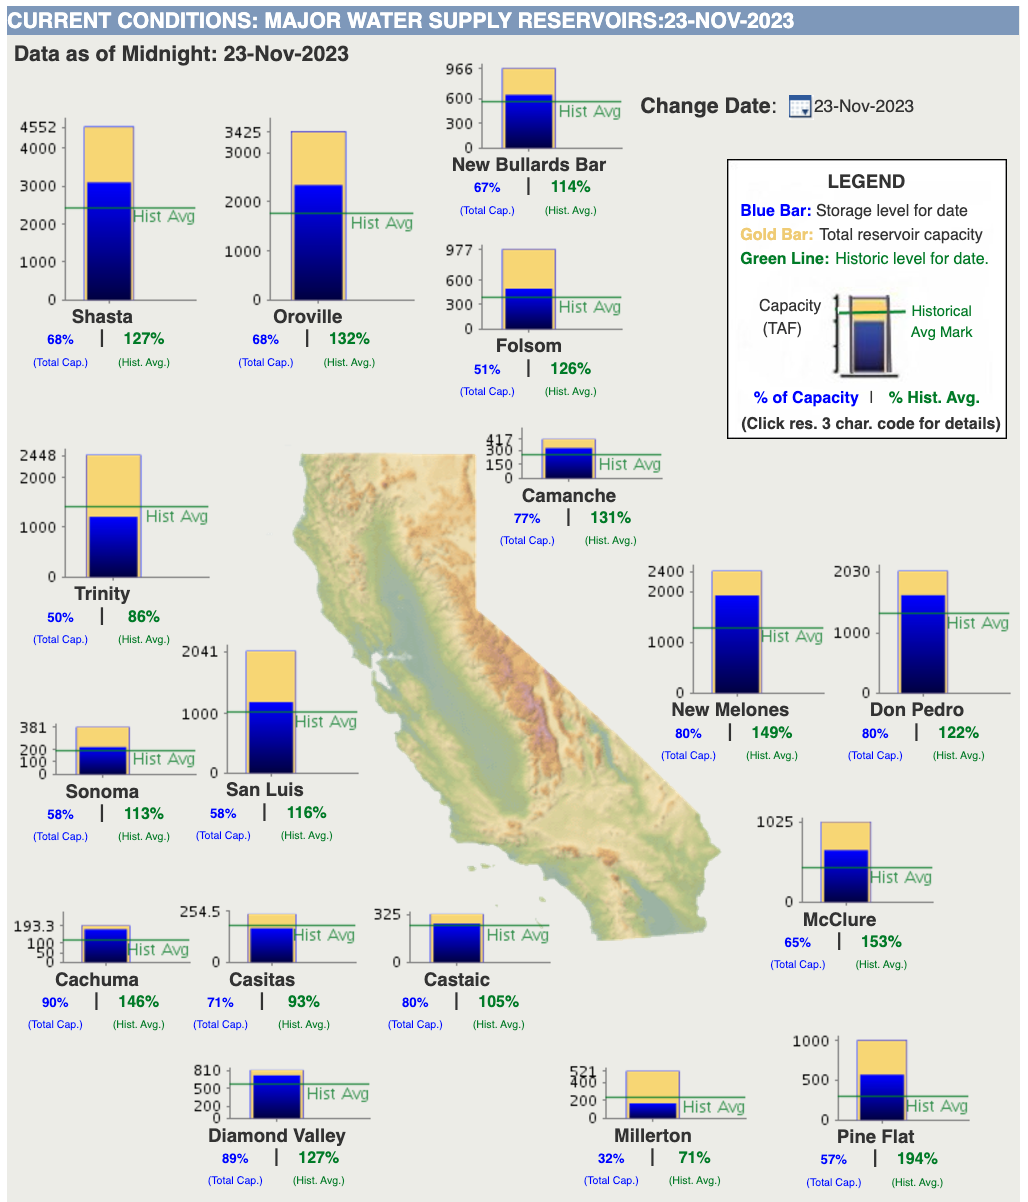
The images above and data below provide a detailed breakdown of year-over-year changes across California’s major water reservoirs:
Shasta
- 2023: 68% of capacity | 127% of historical average
- 2024: 58% of capacity | 107% of historical average
- Change: Decrease in both percentage of capacity (-10%) and historical average (-20%).
Oroville
- 2023: 68% of capacity | 132% of historical average
- 2024: 51% of capacity | 99% of historical average
- Change: Decrease in both percentage of capacity (-17%) and historical average (-33%).
Folsom
- 2023: 51% of capacity | 126% of historical average
- 2024: 35% of capacity | 86% of historical average
- Change: Decrease in both percentage of capacity (-16%) and historical average (-40%).
New Bullards Bar
- 2023: 67% of capacity | 114% of historical average
- 2024: 61% of capacity | 105% of historical average
- Change: Decrease in both percentage of capacity (-6%) and historical average (-9%).
Trinity
- 2023: 50% of capacity | 86% of historical average
- 2024: 67% of capacity | 116% of historical average
- Change: Increase in both percentage of capacity (+17%) and historical average (+30%).
San Luis
- 2023: 58% of capacity | 116% of historical average
- 2024: 52% of capacity | 104% of historical average
- Change: Decrease in both percentage of capacity (-6%) and historical average (-12%).
Camanche
- 2023: 77% of capacity | 131% of historical average
- 2024: 76% of capacity | 130% of historical average
- Change: Minimal decrease in both percentage of capacity (-1%) and historical average (-1%).
New Melones
- 2023: 80% of capacity | 149% of historical average
- 2024: 75% of capacity | 140% of historical average
- Change: Decrease in both percentage of capacity (-5%) and historical average (-9%).
Don Pedro
- 2023: 80% of capacity | 122% of historical average
- 2024: 69% of capacity | 105% of historical average
- Change: Decrease in both percentage of capacity (-11%) and historical average (-17%).
McClure
- 2023: 65% of capacity | 153% of historical average
- 2024: 63% of capacity | 149% of historical average
- Change: Slight decrease in both percentage of capacity (-2%) and historical average (-4%).
Sonoma
- 2023: 58% of capacity | 113% of historical average
- 2024: 65% of capacity | 127% of historical average
- Change: Increase in both percentage of capacity (+7%) and historical average (+14%).
Cachuma
- 2023: 90% of capacity | 146% of historical average
- 2024: 90% of capacity | 146% of historical average
- Change: No change in both metrics.
Casitas
- 2023: 71% of capacity | 93% of historical average
- 2024: 96% of capacity | 126% of historical average
- Change: Increase in both percentage of capacity (+25%) and historical average (+33%).
Castaic
- 2023: 80% of capacity | 105% of historical average
- 2024: 79% of capacity | 103% of historical average
- Change: Slight decrease in both percentage of capacity (-1%) and historical average (-2%).
Diamond Valley
- 2023: 89% of capacity | 127% of historical average
- 2024: 97% of capacity | 139% of historical average
- Change: Increase in both percentage of capacity (+8%) and historical average (+12%).
Millerton
- 2023: 32% of capacity | 71% of historical average
- 2024: 39% of capacity | 86% of historical average
- Change: Increase in both percentage of capacity (+7%) and historical average (+15%).
Pine Flat
- 2023: 57% of capacity | 194% of historical average
- 2024: 41% of capacity | 138% of historical average
- Change: Decrease in both percentage of capacity (-16%) and historical average (-56%).
Summary
- Reservoirs such as Trinity, Sonoma, Casitas, and Diamond Valley experienced significant improvements in water levels.
- Others like Shasta, Oroville, Folsom, and Pine Flat saw marked declines.
- Reservoirs like Cachuma and Camanche maintained steady levels year-over-year.
What This Means for California
The mixed trends in reservoir levels underscore the importance of monitoring water usage and preparing for potential drought conditions. As California enters the rainy season, residents and policymakers will be watching closely to see whether the state’s reservoirs can recover from the recent declines.
State officials are urging residents to continue practicing water conservation and remain mindful of the challenges posed by climate variability.
Looking Ahead
With winter storms on the horizon, the coming months will be critical in determining whether California can replenish its water storage. Long-term solutions, such as infrastructure improvements, groundwater recharge projects, and conservation programs, remain key to addressing the state’s water challenges.
For now, the state’s water levels reflect the delicate balance between supply and demand, as well as the ongoing impact of a changing climate.


