S&P 500 Sector Performance Analysis during the first Donald Trump Administration (2017-2020)
From the "Trump Bump" to the pandemic crash, the 2017-2020 market was a story of extremes. Technology thrived, Energy collapsed, and the entire market reacted to a volatile four years of trade policy, deregulation, and a once-in-a-century economic shock.
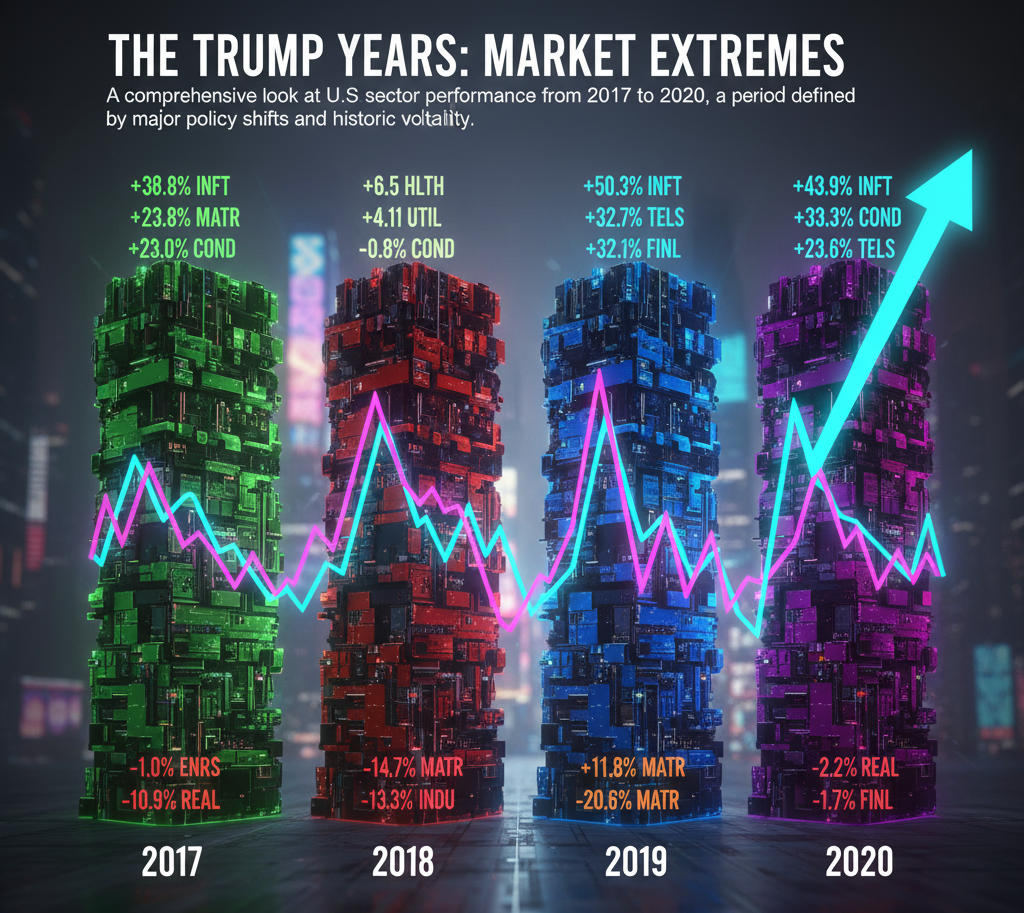
The four-year period of Donald Trump's first presidency, 2017 to 2020, was one of significant gains, sharp volatility, and historic divergence in the U.S. stock market. The S&P 500 itself saw a strong performance of +21.8% in 2017, a pullback of -4.4% in 2018, a massive rebound of +31.5% in 2019, and a resilient gain of +18.4% in 2020.
Beyond the benchmark, the performance of individual sectors tells a more dramatic story, shaped by major economic events like the 2017 Tax Cuts and Jobs Act, the U.S.-China trade war in 2018-2019, and the COVID-19 pandemic in 2020.

Disclaimers & References
Disclaimer: The information and data presented are for informational purposes only and should not be considered financial advice. Past performance is not an indicator or guarantee of future results. All investments involve risk, including the possible loss of principal.
Reference: Data sourced from Novel Investor, available here.
🔑 Key Trends from 2017-2020
Based on the data, four dominant trends emerged during this period:
1) The Unstoppable Rise of Tech:
Information Technology (INFT) was the undisputed leader, finishing as the #1 performing sector in three of the four years (2017, 2019, 2020). Its gains were immense, including +50.3% in 2019 and +43.9% in 2020, reflecting the sector's accelerating dominance in the modern economy.
2) The "V-Shaped" Volatility:
The period was not a smooth ride. After a strong 2017, markets were hit hard in 2018 as U.S.-China trade tensions escalated, leading to 8 of 11 sectors posting a loss. This was immediately followed by a powerful "risk-on" rebound in 2019, where every single sector finished with double-digit gains.
3) The Total Collapse of Energy:
The Energy (ENRS) sector was the single worst-performing group across this period. It was the worst-performing sector in 2018 (-18.1%) and 2020 (-33.7%), and the second-worst in 2017 (-1.0%). Even in 2019's massive rally, it finished in last place.
4) The Great Pandemic Divergence of 2020:
The final year of the period showed a stark "K-shaped" recovery. The COVID-19 pandemic and subsequent lockdowns crushed sectors reliant on physical movement, like Energy (-33.7%) and Real Estate (-2.2%). Simultaneously, it massively benefited "stay-at-home" sectors, leading to explosive growth in Information Technology (+43.9%) and Consumer Discretionary (+33.3%).
📊 Detailed Year-by-Year Performance (2017-2020)
Here is the complete performance breakdown for all sectors for each of the four years, ranked from best to worst.
2017: Broad-Based Gains
Context: A year of strong, steady growth and low volatility, spurred in part by anticipation and passage of the Tax Cuts and Jobs Act.
2018: Trade War Downturn
Context: A sharp reversal from the prior year. Market volatility spiked due to escalating U.S.-China trade tariffs, leading to a negative year for the S&P 500 and most sectors.
2019: Massive Rebound
Context: A powerful rally year, as markets recovered from 2018's fears. Easing trade tensions and a supportive Federal Reserve policy helped propel every single sector to strong positive returns.
2020: The Pandemic Divergence
Context: A year of unprecedented volatility. It saw the fastest bear market crash in history (February-March) due to the COVID-19 pandemic, followed by a stunning recovery fueled by massive government stimulus.