Understanding the USGS Real-Time California Streamflow Conditions Map
This interactive point-map provides a real-time snapshot of water conditions across California. Developed by the USGS, it compares current data from individual gauging stations against decades of historical records for the same day to identify localized trends and peak flow events.
The USGS Streamflow Conditions Map provides a visual representation of real-time streamflow conditions across California, showing how current water levels at individual gauging stations compare to historical records for the same day of the year.
Key Features and Functionality
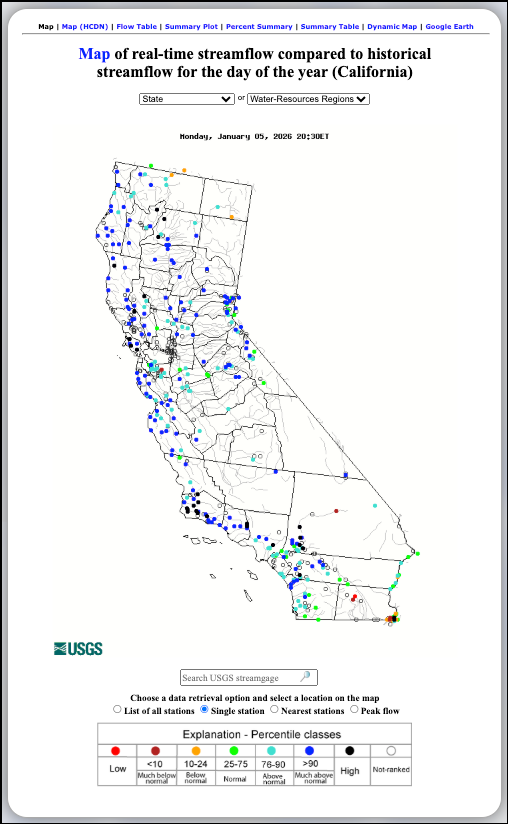
- Real-Time Data Comparison: The map displays individual USGS gauging stations as color-coded points, allowing for an immediate assessment of localized water conditions throughout the state.
- Data Retrieval Options: Beneath the map, interactive buttons allow users to choose how they want to access specific site information:
- List of all stations: Generates a full list of all gages currently shown on the map.
- Single station: Focuses on detailed data for a specific selected gage.
- Nearest stations: Identifies gages located closest to a user-specified point.
- Peak flow: Filters the map to highlight gages experiencing peak flow events.
- Search and Filter Tools: * Search USGS streamgage: A search bar at the bottom allows users to quickly find a station by name or ID.
- Geographic Filters: Dropdown menus at the top allow users to toggle the view between the entire state or specific Water-Resources Regions.
- Navigational Links: A header menu provides quick access to related formats, including the Flow Table, Summary Plot, and Dynamic Map.
Understanding the Map Legend (Percentile Classes)
The gauging stations are color-coded based on their flow percentiles, indicating how the current flow compares to the historical record for this date:
- Black: High
- Dark Blue (>90): Much above normal
- Light Blue (76–90): Above normal
- Green (25–75): Normal
- Orange (10–24): Below normal
- Dark Red (<10): Much below normal
- Red: Low
- White Circle: Not-ranked (indicates a site without a long enough historical record for percentile calculation)
Learn More About Tracking California Water Levels
Use the guides below to navigate the various tools and data visualizations provided by the USGS. These resources are designed to help you interpret real-time streamflow maps, historical runoff comparisons, and regional water conditions across California.
- USGS California Streamflow Map
- USGS California Comparison of Streamflow Maps
- USGS California Streamflow Summary
- USGS California Cumulative Runoff Hydrograph
- USGS California Duration Hydrograph
- USGS California Cumulative Percent Summary
- USGS California Regional Class Summary
- USGS California Area-Based Streamflow Map
- USGS California Streamflow Conditions Map