Understanding the USGS California Streamflow Summary Index
This tool tracks the "Average Streamflow Index" for the entire state, offering a high-level visual summary of hydrological health. By plotting current data against a 30-year historical baseline, the USGS helps users identify major wet or dry cycles occurring since July 1999.
The USGS Streamflow Summary (officially titled the Time series plot of real-time streamflow) provides a high-level visual summary of how current streamflow conditions across California compare to historical records over time.
Key Features and Functionality
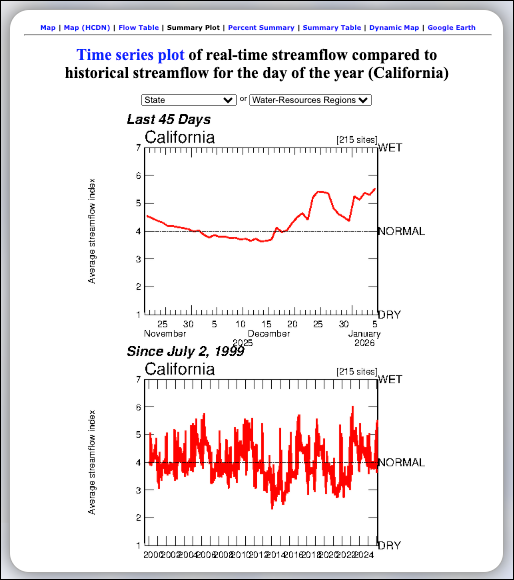
- Average Streamflow Index: The plots use a red line to represent the average streamflow index, which is calculated based on data from numerous streamgaging sites (e.g., 215 sites) across the state.
- Dual Time Perspectives:
- Last 45 Days: This plot offers a detailed look at recent trends, showing daily fluctuations over the previous month and a half.
- Long-Term (Since July 2, 1999): This plot provides historical context by showing the streamflow index from 1999 to the present, allowing users to identify long-term patterns and major wet or dry periods.
- Contextual Benchmarks: Both graphs include a horizontal dashed line representing NORMAL conditions. The vertical scale ranges from DRY (index of 1) to WET (index of 7), providing an immediate sense of the state's overall hydrological status.
- Navigation & Alternative Views: Links at the top of the page allow users to quickly switch to related data formats, including a Flow Table, Percent Summary, Summary Table, Dynamic Map, or a view in Google Earth.
Understanding the Index
- When the red line is above the "NORMAL" dashed line, the state is experiencing wetter-than-average conditions for those dates.
- When the red line falls below the "NORMAL" line, conditions are drier than the historical average for those dates.
Learn More About Tracking California Water Levels
Use the guides below to navigate the various tools and data visualizations provided by the USGS. These resources are designed to help you interpret real-time streamflow maps, historical runoff comparisons, and regional water conditions across California.
- USGS California Streamflow Map
- USGS California Comparison of Streamflow Maps
- USGS California Streamflow Summary
- USGS California Cumulative Runoff Hydrograph
- USGS California Duration Hydrograph
- USGS California Cumulative Percent Summary
- USGS California Regional Class Summary
- USGS California Area-Based Streamflow Map
- USGS California Streamflow Conditions Map