

2026 California House races master guide: All 52 districts on the November 3 ballot under Newsom's Prop 50 map
All 52 of California's U.S. House seats are on the November 3 ballot, the first general election under Gavin Newsom's Prop 50 map. This guide lists every district's candidates, June primary results, registration and money, with the 11 closest seats, nine same-party races and four open seats.


All 52 of California's seats in the U.S. House of Representatives are on the November 3, 2026 ballot, and this is the first general election held under the Prop 50 map.
Voters approved Proposition 50 on November 4, 2025, with 64.4% of the vote, the Secretary of State's Statement of Vote shows. The measure set aside the districts drawn by the independent Citizens Redistricting Commission and put the Legislature's map in their place for congressional elections through 2030.
The Secretary of State's certified list of candidates names two finalists in each district. Forty-nine of the state's 52 current House members are running. Four districts have no incumbent on the ballot, and nine match two candidates from the same party. In the 40th District, two sitting Republicans, Ken Calvert and Young Kim, are running against each other. California's delegation today is 43 Democrats, eight Republicans and one independent, according to the House Clerk's member list as of October 1.
The new lines changed the partisan math.
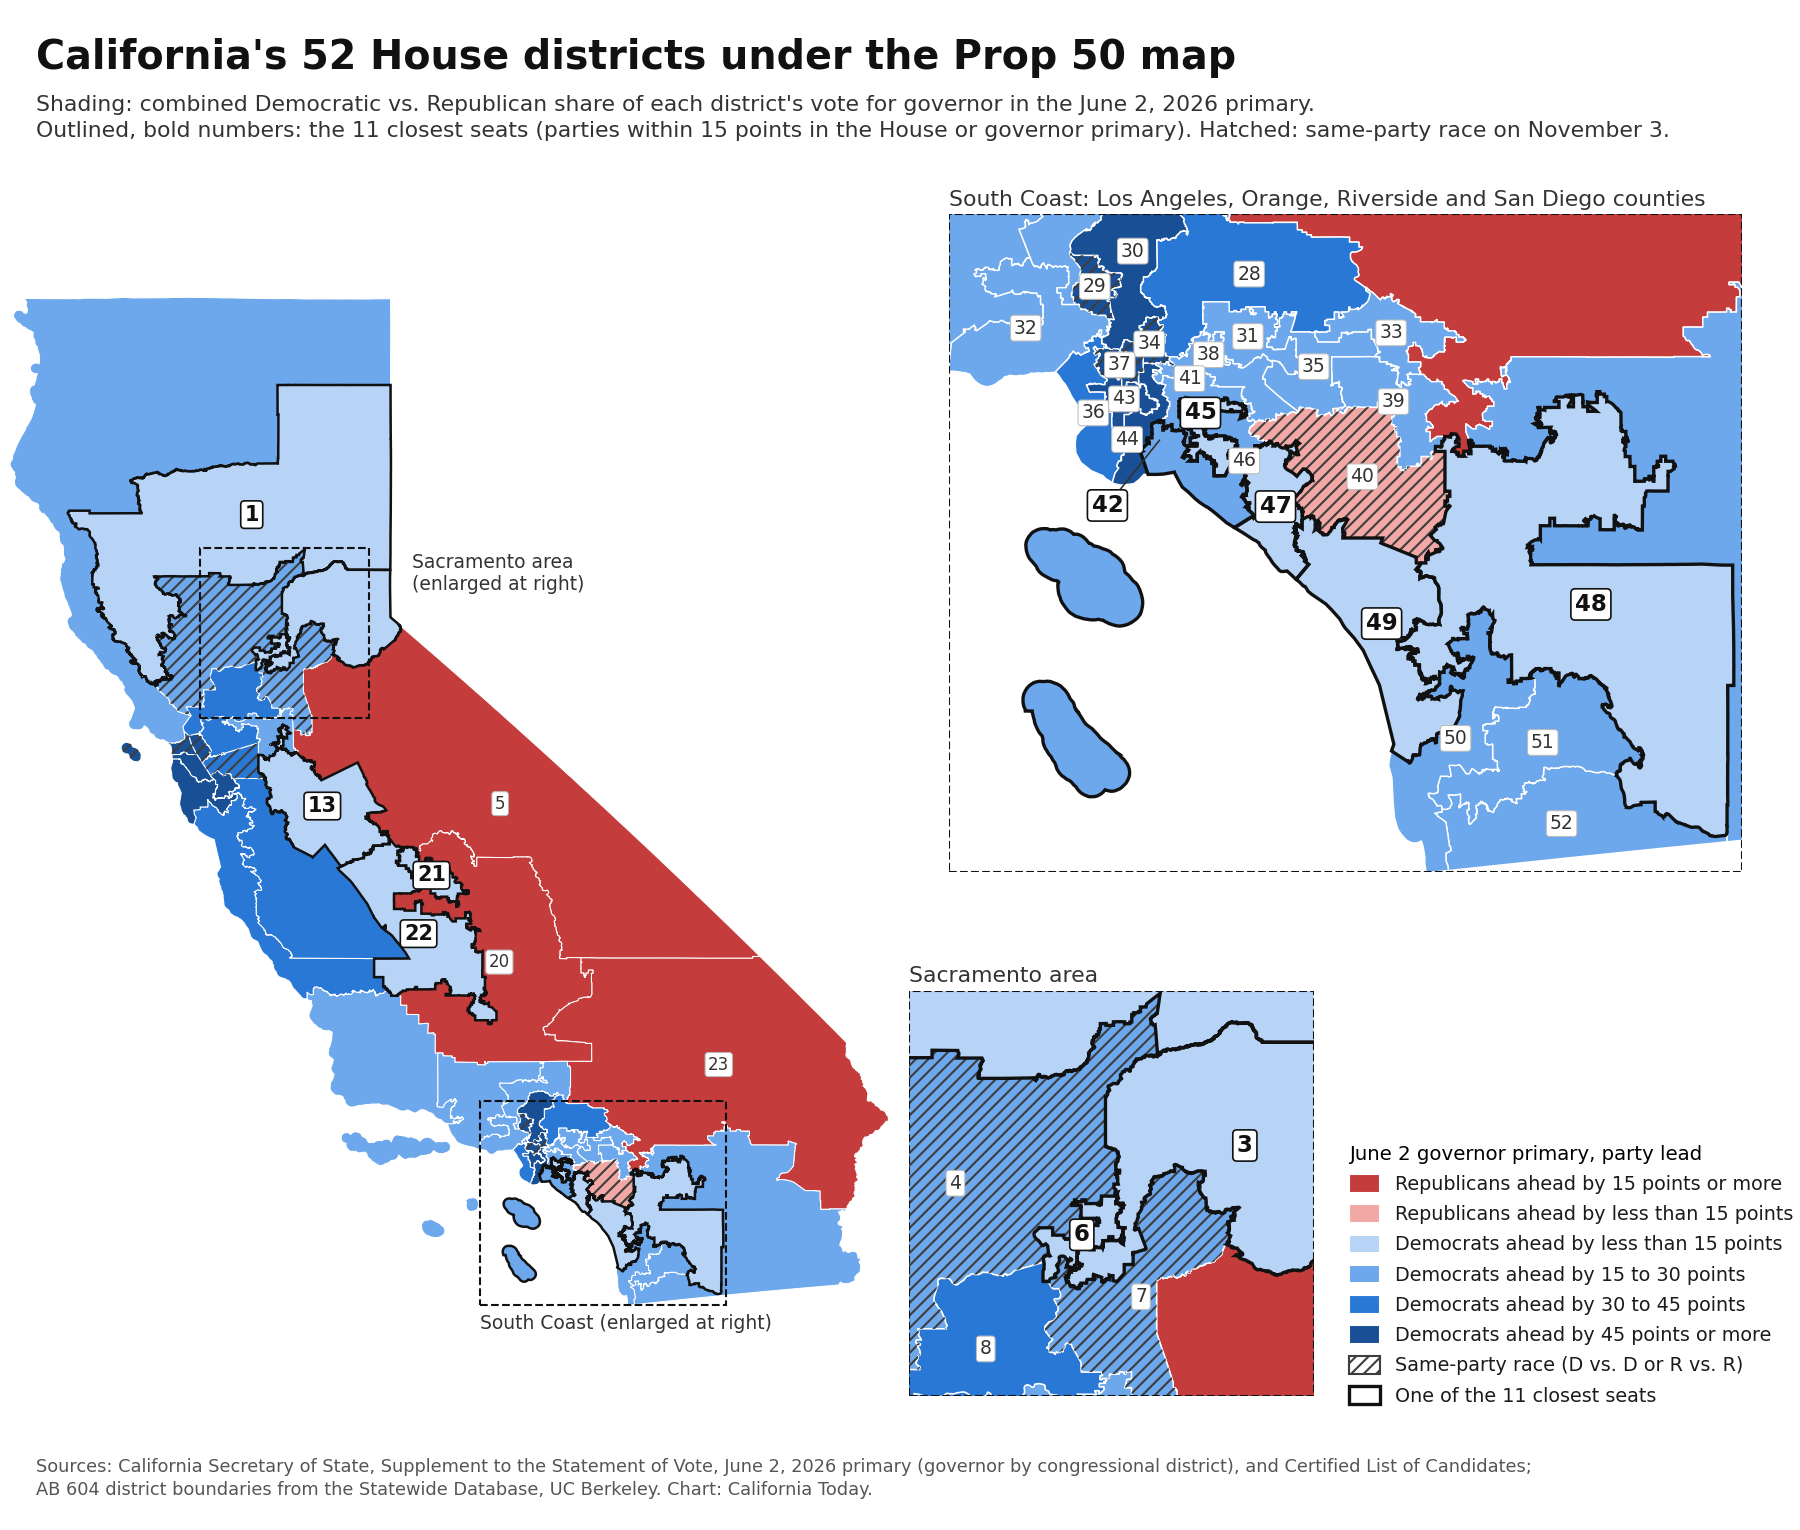
Under the commission's map, nine districts had more registered Republicans than Democrats in the Secretary of State's October 2025 report of registration. Under the Prop 50 map, four do in the October 19, 2026 report: the 5th, 20th, 23rd and 40th. By our count, those are also the only four districts where Republican candidates won a majority of the June 2 primary vote, in both the House race and the governor's race.
This guide lists every district's candidates, June results, registration and money in one table, then gives the 11 closest seats their own sections. Our voting master guide covers how and where to vote. Our candidates master guide covers the statewide races and the propositions master guide covers all 14 measures. For how the map came about, see our Prop 50 explainer.
The Prop 50 map replaced California's commission-drawn House districts for 2026:
Proposition 50 was a legislative constitutional amendment, Assembly Constitutional Amendment 8, which passed the state Senate 30–8 and the Assembly 57–20, according to the official voter guide for the November 2025 special election.
 Mac Douglass | Editor
It adds a section to Article XXI of the California Constitution. The new districts are the ones drawn in Assembly Bill 604 of 2025, and the measure's text says they
"...shall temporarily be used for every congressional election for a term of office commencing on or after the date this subdivision becomes operative and before the certification of new congressional boundary lines drawn by the Citizens Redistricting Commission."
—Proposition 50, text of proposed law
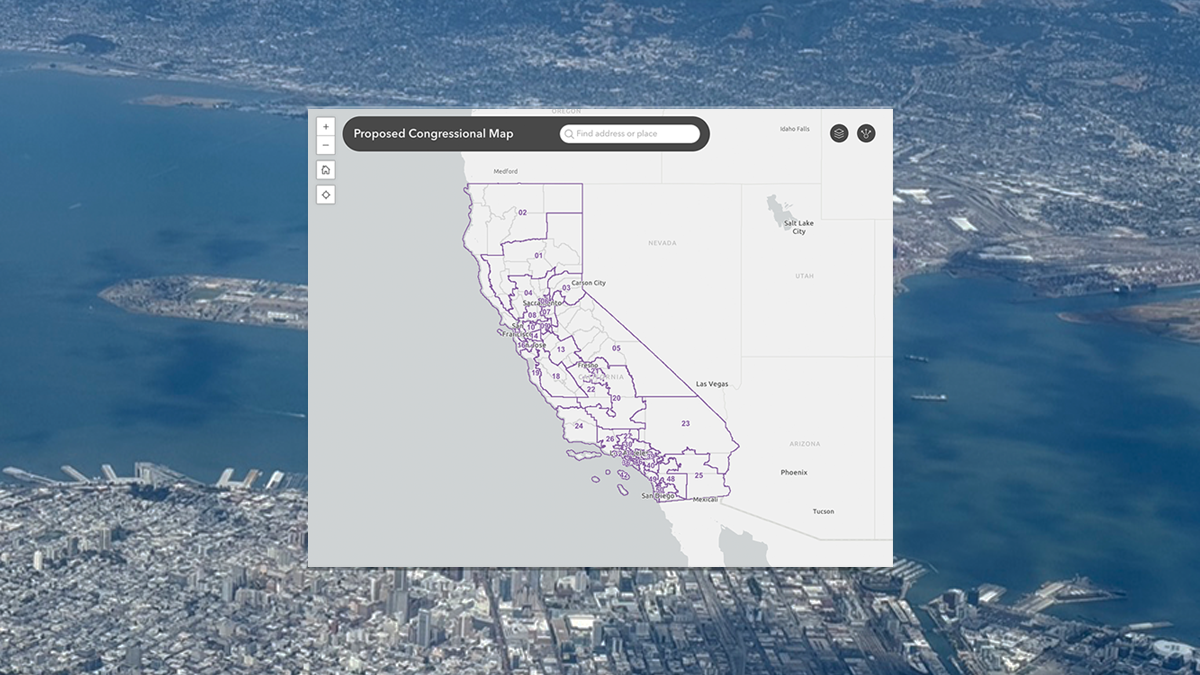
The commission takes the job back in 2031, after the 2030 census. The Legislative Analyst noted that the total number of districts would not change and that most California districts "would change at least some" under the new maps. The Statewide Database at UC Berkeley publishes the AB 604 district boundaries used in the map below. Our Prop 50 results page has the measure's vote counts and the new district map.
Two special elections this year filled vacancies for the rest of the current term, and both were held in the old districts:
- 1st District: Gov. Gavin Newsom called the election after the death of Rep. Doug LaMalfa. Republican James Gallagher won outright in the June 2 special primary with 62.1% of the vote across 10 counties of the old district, the Secretary of State's official canvass shows. He was sworn in on June 10.
- 14th District: The vacancy followed Rep. Eric Swalwell's resignation. Democrat Aisha Wahab beat fellow Democrat Melissa Hernandez 53.1% to 46.9% in the August 18 special general election and was sworn in on September 2.
Gallagher and Wahab are both on the November ballot again, in the new 1st and 14th districts.
Registered Republicans outnumber Democrats in four districts under the Prop 50 map:
The Secretary of State counts registered voters by party in every district before each statewide election. Comparing the October 2025 report, the last before Prop 50 passed, with this October's report shows how far the map moved:
- Commission map, October 20, 2025: Republicans outnumbered Democrats in nine districts, the 1st, 3rd, 5th, 20th, 23rd, 40th, 41st, 47th and 48th, according to the registration by district.
- Prop 50 map, October 19, 2026: Republicans outnumber Democrats in four, the 5th, 20th, 23rd and 40th, the 2026 registration by district shows.
- Statewide, over the same year: Democrats went from 44.9% to 45.0% of registered voters and Republicans from 25.2% to 24.7%, by our math. The drop from nine districts to four reflects where the lines fall, not a statewide shift.
Between 18% and 31% of the registered voters in each district state no party preference, so registration is a guide to a district's lean rather than a count of votes.
 Mac Douglass | Editor
California's top-two primary chose the two House finalists in each district:
California elects House members in a top-two system. Every candidate appears on one primary ballot, and only the top two vote-getters move on to the general election, whatever their party preference, the Secretary of State's primary elections page explains. The June 2 primary produced these November matchups:
- 42 districts with a Democrat against a Republican.
- 8 districts with two Democrats: the 4th, 7th, 11th, 12th, 14th, 29th, 34th and 37th.
- 1 district with two Republicans: the 40th.
- 1 district with a Democrat against a candidate with no party preference: the 6th.
Some June results were close enough to change the shape of a race. In the 40th, Democratic candidates won 43.0% of the vote combined, but five Democrats split it, and the leader among them, Esther Kim-Varet, finished third, 8,746 votes behind Kim. In the 4th, Democrat Eric Jones took second place from Republican Ray Riehle by 3,109 votes, 45,992 to 42,883, according to the June Statement of Vote.
Two challengers finished ahead of incumbents. Democrat Mai Vang out-polled Rep. Doris Matsui in the 7th, 65,617 votes to 61,114. Republican Jason Gibbs edged Rep. George Whitesides in the 27th by 544 votes, 62,758 to 62,214, although Democratic candidates there won 59.0% of the vote combined. In the 1st, Gallagher led McGuire by 854 votes.
The June electorate was much smaller than the last general election's. The primary drew 9,446,461 voters, 40.8% of those registered, according to the Secretary of State's participation statistics. The November 2024 general election drew 16,140,044, or 71.4%, the 2024 statistics show. June shares describe how each district's primary voters split. They are not a forecast for November.
Three measures of each California House district's lean, and the rule for the closest seats:
The table and the sections below use three measures, all from the Secretary of State:
- The House primary vote: the combined share of all Democratic candidates and all Republican candidates in each district's June 2 House primary, from the Statement of Vote.
- The governor primary vote: the same split for the June 2 governor's race inside each district, from the Supplement to the Statement of Vote. The governor's race had the same candidates in every district, so it works as a common yardstick.
- Registration: each party's share of registered voters on October 19, from the report of registration by district.
We count a seat among the closest when the Democratic and Republican candidates finished within 15 points of each other on either of the two June measures. Same-party races are left out. Eleven seats qualify. The 25th, 23rd and 27th just miss. This describes June's vote. It does not rate or predict the races.
All 52 California House districts, candidates and June results:
The table lists every district with its counties, both finalists with their June share and money raised, the June party vote in the House and governor's races, and party registration. Money is each candidate's total receipts for 2025–26 through October 14, as reported to the Federal Election Commission. Incumbents running in a district with a new number are marked with the district they represent now.
| District and counties | Candidates on the November 3 ballot | June 2 House primary, party vote | June 2 governor primary in the district | Registered voters, Oct. 19 | Matchup |
|---|---|---|---|---|---|
| 1stButte, Glenn, Lake, Lassen, Mendocino, Plumas, Sierra, Sonoma, Tehama | Mike McGuire (D)41.8% in June · $2.27M raised James Gallagher (R)42.1% in June · $2.00M raisedIncumbent | D 56.8% R 42.1% | D 56.5% R 42.1% | D 40.8% R 30.9% NPP 19.2% | D vs. R Closest 11 |
| 2ndDel Norte, Humboldt, Marin, Mendocino, Modoc, Shasta, Siskiyou, Sonoma, Trinity | Jared Huffman (D)56.5% in June · $1.21M raisedIncumbent Robin Littau (R)11.4% in June · no FEC report on file | D 64.1% R 30.4% | D 64.1% R 34.7% | D 44.7% R 27.5% NPP 19.2% | D vs. R |
| 3rdEl Dorado, Nevada, Placer, Sacramento | Ami Bera (D)34.3% in June · $1.49M raisedIncumbent (currently represents the 6th) Robb Tucker (R)29.9% in June · $305K raised | D 55.7% R 43.2% | D 55.3% R 43.4% | D 38.9% R 31.0% NPP 21.1% | D vs. R Closest 11 |
| 4thColusa, Lake, Napa, Placer, Sacramento, Sonoma, Sutter, Yolo, Yuba | Eric Jones (D)22.2% in June · $18.06M raised Mike Thompson (D)41.0% in June · $5.48M raisedIncumbent | D 63.2% R 36.1% | D 59.2% R 39.5% | D 42.4% R 29.0% NPP 20.2% | D vs. D Same party |
| 5thAlpine, Amador, Calaveras, El Dorado, Fresno, Inyo, Madera, Mariposa, Mono, San Joaquin, Stanislaus, Tuolumne | Michael Masuda (D)24.3% in June · $582K raised Tom McClintock (R)61.3% in June · $1.25M raisedIncumbent | D 38.7% R 61.3% | D 39.5% R 59.4% | D 29.3% R 43.7% NPP 18.3% | D vs. R |
| 6thPlacer, Sacramento, Yolo | Richard Pan (D)23.2% in June · $2.55M raised Kevin Kiley (NPP)24.3% in June · $3.72M raisedIncumbent (currently represents the 3rd) | D 55.6% R 20.1% | D 56.4% R 42.2% | D 39.2% R 30.3% NPP 21.9% | D vs. No party Closest 11 |
| 7thEl Dorado, Sacramento, San Joaquin | Doris Matsui (D)29.1% in June · $7.84M raisedIncumbent Mai Vang (D)31.2% in June · $1.83M raised | D 63.0% R 37.0% | D 57.9% R 40.8% | D 42.3% R 28.3% NPP 21.4% | D vs. D Same party |
| 8thContra Costa, Sacramento, San Joaquin, Solano, Yolo | John Garamendi (D)54.4% in June · $583K raisedIncumbent Rudy Recile (R)27.8% in June · $20K raised | D 72.2% R 27.8% | D 69.5% R 29.0% | D 51.5% R 19.5% NPP 22.0% | D vs. R |
| 9thContra Costa, San Joaquin | Josh Harder (D)60.8% in June · $4.49M raisedIncumbent John McBride (R)23.3% in June · $77K raised | D 60.8% R 39.2% | D 59.0% R 39.2% | D 45.1% R 24.6% NPP 22.6% | D vs. R |
| 10thAlameda, Contra Costa | Mark DeSaulnier (D)59.7% in June · $722K raisedIncumbent Jeff Frese (R)12.9% in June · no FEC report on file | D 68.9% R 31.1% | D 67.4% R 31.7% | D 48.2% R 22.0% NPP 22.9% | D vs. R |
| 11thSan Francisco | Connie Chan (D)29.7% in June · $2.40M raised Scott Wiener (D)40.7% in June · $5.81M raised | D 94.0% R 5.8% | D 87.5% R 11.0% | D 63.4% R 7.3% NPP 23.8% | D vs. D Same partyOpen seat |
| 12thAlameda | Jamie Joyce (D)15.6% in June · $70K raised Lateefah Simon (D)84.2% in June · $1.70M raisedIncumbent | D 99.8% R 0.2% | D 90.3% R 8.2% | D 66.7% R 6.1% NPP 21.9% | D vs. D Same party |
| 13thFresno, Madera, Merced, San Joaquin, Stanislaus | Adam Gray (D)42.0% in June · $5.24M raisedIncumbent Kevin Lincoln (R)27.7% in June · $2.97M raised | D 57.1% R 42.9% | D 54.5% R 43.7% | D 41.6% R 27.0% NPP 23.6% | D vs. R Closest 11 |
| 14thAlameda | Melissa Hernandez (D)17.2% in June · $2.11M raised Aisha Wahab (D)38.3% in June · $1.21M raisedIncumbent | D 73.6% R 25.3% | D 71.2% R 27.5% | D 49.6% R 17.2% NPP 27.6% | D vs. D Same party |
| 15thSan Francisco, San Mateo | Kevin Mullin (D)65.0% in June · $982K raisedIncumbent Charles Hoelter (R)18.4% in June · no FEC report on file | D 77.9% R 18.4% | D 76.8% R 21.9% | D 54.6% R 13.7% NPP 25.9% | D vs. R |
| 16thSan Mateo, Santa Clara | Sam Liccardo (D)75.6% in June · $3.87M raisedIncumbent Peter Sundin Soulé (R)10.8% in June · $4K raised | D 75.6% R 21.0% | D 74.9% R 24.1% | D 51.5% R 16.2% NPP 27.1% | D vs. R |
| 17thAlameda, Santa Clara | Ro Khanna (D)62.3% in June · $15.32M raisedIncumbent Ritesh Tandon (R)14.8% in June · $57K raised | D 73.6% R 25.6% | D 72.6% R 25.9% | D 48.6% R 15.7% NPP 31.1% | D vs. R |
| 18thFresno, Kings, Monterey, San Benito, Santa Clara, Santa Cruz | Zoe Lofgren (D)54.9% in June · $1.98M raisedIncumbent Shane Lewis (R)29.3% in June · $115K raised | D 67.8% R 29.3% | D 68.3% R 30.3% | D 50.6% R 19.6% NPP 23.4% | D vs. R |
| 19thMonterey, San Luis Obispo, Santa Clara, Santa Cruz | Jimmy Panetta (D)58.4% in June · $3.62M raisedIncumbent Peter Coe Verbica (R)20.5% in June · $86K raised | D 69.9% R 26.8% | D 68.7% R 30.3% | D 48.8% R 21.9% NPP 22.3% | D vs. R |
| 20thFresno, Kern, Kings, Tulare | Sandra Van Scotter (D)28.8% in June · $48K raised Vince Fong (R)68.2% in June · $2.41M raisedIncumbent | D 28.8% R 68.2% | D 33.2% R 65.6% | D 26.0% R 46.2% NPP 19.2% | D vs. R |
| 21stFresno, Tulare | Jim Costa (D)42.2% in June · $1.69M raisedIncumbent Kyle Kirkland (R)26.3% in June · $465K raised | D 57.6% R 41.2% | D 56.4% R 41.7% | D 40.9% R 26.8% NPP 23.4% | D vs. R Closest 11 |
| 22ndFresno, Kern, Kings, Madera, Tulare | Randy Villegas (D)32.4% in June · $5.94M raised David G. Valadao (R)40.7% in June · $6.33M raisedIncumbent | D 59.3% R 40.7% | D 56.4% R 41.6% | D 42.2% R 25.5% NPP 24.3% | D vs. R Closest 11 |
| 23rdKern, Los Angeles, Riverside, San Bernardino | Tessa Lynn Hodge (D)21.3% in June · $127K raised Jay Obernolte (R)57.1% in June · $1.85M raisedIncumbent | D 37.7% R 57.1% | D 41.5% R 57.2% | D 31.7% R 37.1% NPP 21.3% | D vs. R |
| 24thSan Luis Obispo, Santa Barbara, Ventura | Salud Carbajal (D)54.4% in June · $1.92M raisedIncumbent Bob Smith (R)35.9% in June · $347K raised | D 61.8% R 35.9% | D 62.9% R 35.9% | D 45.1% R 26.2% NPP 20.4% | D vs. R |
| 25thImperial, Riverside, San Bernardino | Raul Ruiz (D)60.0% in June · $2.46M raisedIncumbent Joe Males (R)18.9% in June · $1.11M raised | D 60.0% R 40.0% | D 56.8% R 41.8% | D 42.0% R 27.9% NPP 22.4% | D vs. R |
| 26thLos Angeles, Ventura | Jacqui Irwin (D)41.3% in June · $1.17M raised Sam Gallucci (R)20.9% in June · $538K raised | D 59.5% R 40.5% | D 58.1% R 40.7% | D 43.0% R 27.9% NPP 21.5% | D vs. R Open seat |
| 27thLos Angeles | George Whitesides (D)40.6% in June · $4.51M raisedIncumbent Jason Gibbs (R)41.0% in June · $414K raised | D 59.0% R 41.0% | D 57.3% R 41.2% | D 42.2% R 27.0% NPP 23.1% | D vs. R |
| 28thLos Angeles, San Bernardino | Judy Chu (D)62.2% in June · $1.38M raisedIncumbent April A. Verlato (R)32.1% in June · $700 raised | D 67.9% R 32.1% | D 65.6% R 33.1% | D 45.0% R 23.0% NPP 25.9% | D vs. R |
| 29thLos Angeles | Angélica María Dueñas (D)24.9% in June · $97K raised Luz Maria Rivas (D)51.0% in June · $1.03M raisedIncumbent | D 76.0% R 24.0% | D 73.6% R 23.8% | D 52.3% R 16.1% NPP 24.9% | D vs. D Same party |
| 30thLos Angeles | Laura Friedman (D)52.7% in June · $995K raisedIncumbent Scott Alan Meyers (R)16.6% in June · $123K raised | D 73.4% R 21.3% | D 74.9% R 23.2% | D 52.3% R 17.6% NPP 23.8% | D vs. R |
| 31stLos Angeles, San Bernardino | Gil Cisneros (D)61.1% in June · $853K raisedIncumbent Eric Ching (R)23.8% in June · $97K raised | D 61.1% R 38.9% | D 60.5% R 38.2% | D 43.8% R 25.6% NPP 23.2% | D vs. R |
| 32ndLos Angeles, Ventura | Brad Sherman (D)36.8% in June · $2.90M raisedIncumbent Larry Thompson (R)32.7% in June · $66K raised | D 66.6% R 32.7% | D 62.3% R 36.5% | D 46.4% R 23.7% NPP 22.8% | D vs. R |
| 33rdRiverside, San Bernardino | Pete Aguilar (D)53.5% in June · $5.68M raisedIncumbent Stephanie M. Vargas (R)17.5% in June · $721 raised | D 61.1% R 38.0% | D 59.6% R 38.8% | D 43.2% R 25.2% NPP 23.1% | D vs. R |
| 34thLos Angeles | Jimmy Gomez (D)46.0% in June · $1.34M raisedIncumbent Angela Gonzales-Torres (D)30.7% in June · $510K raised | D 85.3% R 13.6% | D 83.0% R 14.1% | D 58.6% R 10.9% NPP 23.8% | D vs. D Same party |
| 35thLos Angeles, Riverside, San Bernardino | Norma J. Torres (D)59.5% in June · $923K raisedIncumbent Mike Cargile (R)40.4% in June · $10K raised | D 59.5% R 40.4% | D 57.7% R 40.9% | D 42.8% R 26.1% NPP 23.6% | D vs. R |
| 36thLos Angeles | Ted W. Lieu (D)60.9% in June · $2.22M raisedIncumbent Houston Brignano (R)15.3% in June · $7K raised | D 70.6% R 28.3% | D 68.5% R 30.4% | D 49.9% R 20.3% NPP 23.3% | D vs. R |
| 37thLos Angeles | Sydney Kamlager-Dove (D)55.2% in June · $1.64M raisedIncumbent Samantha Mota (D)11.7% in June · $13K raised | D 82.7% R 10.7% | D 85.6% R 12.5% | D 62.4% R 8.6% NPP 22.1% | D vs. D Same party |
| 38thLos Angeles, Orange | Hilda Solis (D)47.6% in June · $1.48M raised Pedro Antonio Casas (R)35.8% in June · no FEC report on file | D 64.2% R 35.8% | D 61.2% R 37.1% | D 45.0% R 24.0% NPP 24.9% | D vs. R Open seat |
| 39thRiverside | Mark Takano (D)61.0% in June · $1.13M raisedIncumbent Steve Manos (R)39.0% in June · $12K raised | D 61.0% R 39.0% | D 58.4% R 40.1% | D 43.7% R 24.9% NPP 23.7% | D vs. R |
| 40thOrange, Riverside | Ken Calvert (R)34.9% in June · $7.05M raisedIncumbent (currently represents the 41st) Young Kim (R)20.6% in June · $10.15M raisedIncumbent | D 43.0% R 55.5% | D 43.6% R 55.4% | D 31.3% R 39.5% NPP 21.3% | R vs. R Same partyTwo incumbents |
| 41stLos Angeles, Orange | Linda Sánchez (D)37.5% in June · $1.90M raisedIncumbent (currently represents the 38th) Mitch Clemmons (R)35.8% in June · $6K raised | D 64.2% R 35.8% | D 61.2% R 37.3% | D 45.8% R 26.0% NPP 21.4% | D vs. R |
| 42ndLos Angeles, Orange | Robert Garcia (D)56.5% in June · $3.39M raisedIncumbent Brian Burley (R)20.6% in June · $251K raised | D 56.5% R 42.3% | D 57.0% R 41.7% | D 40.7% R 29.9% NPP 21.6% | D vs. R Closest 11 |
| 43rdLos Angeles | Maxine Waters (D)63.8% in June · $1.11M raisedIncumbent Cristian Morales (R)16.9% in June · $15K raised | D 83.1% R 16.9% | D 80.9% R 16.9% | D 57.8% R 11.6% NPP 23.1% | D vs. R |
| 44thLos Angeles | Nanette Diaz Barragan (D)77.0% in June · $1.02M raisedIncumbent Genevieve Angel (R)23.0% in June · $22K raised | D 77.0% R 23.0% | D 75.2% R 22.5% | D 54.6% R 15.0% NPP 23.7% | D vs. R |
| 45thLos Angeles, Orange | Derek Tran (D)53.8% in June · $5.99M raisedIncumbent Chuong V. Vo (R)15.3% in June · $937K raised | D 53.8% R 46.2% | D 55.2% R 43.1% | D 38.8% R 30.1% NPP 25.3% | D vs. R Closest 11 |
| 46thOrange | Lou Correa (D)51.9% in June · $1.49M raisedIncumbent David Pan (R)32.9% in June · $104K raised | D 67.1% R 32.9% | D 63.8% R 34.4% | D 46.0% R 23.9% NPP 23.9% | D vs. R |
| 47thOrange | Dave Min (D)45.4% in June · $3.87M raisedIncumbent Jenny Rae Le Roux (R)25.0% in June · $592K raised | D 54.0% R 42.9% | D 54.6% R 44.4% | D 36.2% R 31.8% NPP 25.6% | D vs. R Closest 11 |
| 48thRiverside, San Diego | Marni von Wilpert (D)20.8% in June · $4.97M raised Jim Desmond (R)38.9% in June · $3.18M raised | D 53.3% R 45.9% | D 53.4% R 45.2% | D 37.1% R 31.9% NPP 22.2% | D vs. R Closest 11Open seat |
| 49thOrange, San Diego | Mike Levin (D)55.9% in June · $3.56M raisedIncumbent Armen Kurdian (R)26.1% in June · $189K raised | D 55.9% R 44.1% | D 54.6% R 44.3% | D 36.7% R 31.5% NPP 24.0% | D vs. R Closest 11 |
| 50thSan Diego | Scott Peters (D)48.1% in June · $2.19M raisedIncumbent Steve Cohen (R)39.8% in June · $4K raised | D 57.9% R 39.8% | D 57.9% R 40.7% | D 39.3% R 28.7% NPP 24.2% | D vs. R |
| 51stSan Diego | Sara Jacobs (D)57.7% in June · $1.86M raisedIncumbent Ricardo Cabrera (R)37.0% in June · no FEC report on file | D 63.0% R 37.0% | D 61.0% R 37.4% | D 42.1% R 27.2% NPP 22.6% | D vs. R |
| 52ndSan Diego | Juan Vargas (D)56.5% in June · $836K raisedIncumbent Jeff Belle (R)33.2% in June · $27K raised | D 66.8% R 33.2% | D 62.9% R 34.9% | D 44.1% R 22.3% NPP 26.4% | D vs. R |
| June shares and party votes: California Secretary of State, Statement of Vote and Supplement to the Statement of Vote, June 2, 2026 primary. Party vote is the combined share of all candidates of each party; the governor columns count the June vote for governor inside each district. Registration: Secretary of State, 15-day Report of Registration, October 19, 2026. Raised: total receipts reported to the Federal Election Commission for the 2025–26 cycle on each candidate's latest report, through October 14, 2026 (September 30 for Rudy Recile). Incumbent: current member of the House as listed by the House Clerk on October 1, 2026; district numbers changed under the Prop 50 map. "Closest 11": Democratic and Republican candidates within 15 points of each other in the June House or governor vote, by our count. Counties: all or part of each county in the district. | |||||
California's 11 closest House races by the June primary vote:
These seats are in district order. Each section gives the June result, the party splits, registration and the money each candidate had raised through October 14, from the FEC's candidate totals.
California's 1st District pits state Sen. Mike McGuire against Rep. James Gallagher:
The new 1st runs from Sonoma, Lake and Mendocino counties east to Butte, Tehama, Glenn, Lassen, Plumas and Sierra, the Secretary of State's registration report shows. It no longer includes Shasta, Siskiyou, Modoc, Colusa, Sutter or Yuba, which were part of the old 1st that Gallagher won in June's special election.
In the regular June 2 primary for the new seat, Gallagher, whose ballot designation is "United States Representative/Farmer," took 42.1% (92,975 votes). McGuire, a "California State Senator," took 41.8% (92,121). Democrat Audrey Denney added 14.2%, so Democratic candidates won 56.8% combined to Republicans' 42.1%, according to the Statement of Vote. In the governor's race, the district split 56.5% Democratic to 42.1% Republican.
- Registration: 40.8% Democratic, 30.9% Republican, 19.2% no party preference. The old 1st had 17.9 points more Republicans than Democrats in October 2025.
- 2024: LaMalfa won the old 1st by 97,956 votes, the 2024 Statement of Vote shows.
- Money: McGuire had raised $2.27 million and had $153,647 in cash. Gallagher had raised $2.00 million and had $327,729.
Rep. Ami Bera is running in California's 3rd District against Republican Robb Tucker:
Bera represents the current 6th District, the House Clerk's member list shows. The new 3rd takes in all or part of El Dorado, Nevada, Placer and Sacramento counties. Under the commission's map, the 3rd was Kevin Kiley's district and ran along the Sierra Nevada as far as Inyo and Mono counties.
Bera led the June primary with 34.3% (76,653 votes). Tucker, a "County Supervisor/Businessman," was second with 29.9% (66,808). Democrat Heidi Hall took 12.8% and Republican Christine Bish 11.9%. Democrats won 55.7% combined and Republicans 43.2%, the Statement of Vote shows. The governor's race split 55.3% to 43.4%.
- Registration: 38.9% Democratic, 31.0% Republican, 21.1% no party preference. The old 3rd had 6.3 points more Republicans than Democrats in October 2025.
- Money: Bera had raised $1.49 million and had $1.65 million in cash. Tucker had raised $304,654 and had $16,451.
Rep. Kevin Kiley runs with no party preference in California's 6th District against Democrat Richard Pan:
Kiley won the old 3rd District as a Republican in 2024, 234,246 votes to 188,067, the 2024 Statement of Vote shows. The House Clerk now lists him as an independent, and the certified list shows him with no party preference and the designation "United States Representative." The new 6th takes in parts of Placer, Sacramento and Yolo counties.
Kiley finished first in June with 24.3% (47,165 votes), according to the Statement of Vote. Pan, a "Doctor/Health Advocate," was 2,157 votes behind with 23.2% (45,008). Republican Michael Stansfield took 20.1%, and Democrats Lauren Babb Tomlinson and Thien Ho took 12.3% and 10.7%. Because Kiley carries no party label, the House vote split by party overstates the gap. In the governor's race, the district went 56.4% Democratic to 42.2% Republican, a 14.2-point margin.
- Registration: 39.2% Democratic, 30.3% Republican, 21.9% no party preference.
- Money: Kiley had raised $3.72 million and had $34,648 in cash. Pan had raised $2.55 million and had $207,936.
Rep. Adam Gray faces Republican Kevin Lincoln in California's 13th District:
Gray won the old 13th in 2024 by 187 votes, 105,554 to 105,367, over Republican Rep. John Duarte. It was the closest House race in California that year, the 2024 Statement of Vote shows. Lincoln ran in the old 9th that year and lost to Rep. Josh Harder, 130,183 to 121,174. The new 13th takes in parts of Fresno, Madera, Merced, San Joaquin and Stanislaus counties.
Gray took 42.0% in June (41,086 votes) and Lincoln, a "Small Business Owner," 27.7% (27,157). Republican Vin Kruttiventi and Democrat Daniel Garibay Rodriguez each took about 15%. Democrats won 57.1% combined to Republicans' 42.9%, the Statement of Vote shows. The governor's race was closer, 54.5% to 43.7%. The 13th cast 97,897 votes in its House primary, the second-fewest of any district.
- Registration: 41.6% Democratic, 27.0% Republican, 23.6% no party preference. Gray's current district had 9.1 points more Democrats than Republicans in October 2025. The new 13th has 14.6.
- Money: Gray had raised $5.24 million and had $848,633 in cash. Lincoln had raised $2.97 million and had $448,388.
Rep. Jim Costa faces Republican Kyle Kirkland in California's 21st District:
Costa won the old 21st in 2024, 102,798 votes to 92,733, the 2024 Statement of Vote shows. The new 21st takes in parts of Fresno and Tulare counties.
Costa took 42.2% in June (43,461 votes) and Kirkland, an "Entrepreneur/Nonprofit CEO," 26.3% (27,076), the Statement of Vote shows. Republican Lorenzo Rios took 14.9%, Democrat Lourin Hubbard 10.3% and Democrat Eric Garcia 5.1%. Democrats won 57.6% combined to Republicans' 41.2%, a 16.4-point gap. The 21st makes the list on the governor's race, which split 56.4% to 41.7%, a 14.7-point gap.
- Registration: 40.9% Democratic, 26.8% Republican, 23.4% no party preference.
- Money: Costa had raised $1.69 million and had $500,767 in cash. Kirkland had raised $464,700 and had $13,101.
Rep. David Valadao faces Democrat Randy Villegas in California's 22nd District:
Valadao won the old 22nd in 2024, 89,484 votes to 78,023, over Democrat Rudy Salas, according to the 2024 Statement of Vote. That district covered parts of Kern, Kings and Tulare counties. The new 22nd adds parts of Fresno and Madera.
Valadao led in June with 40.7% (32,491 votes), the only Republican in the race, the Statement of Vote shows. Villegas, a "Teacher/Business Owner," took 32.4% (25,808), and Democrat Jasmeet Bains took 26.9%. That put Democrats at 59.3% combined. In the governor's race, the district split 56.4% to 41.6%, a 14.8-point gap. The 22nd cast 79,757 votes in its House primary, the fewest of any California district.
- Registration: 42.2% Democratic, 25.5% Republican, 24.3% no party preference. The old 22nd had 11.7 points more Democrats than Republicans in October 2025. The new 22nd has 16.7.
- Money: Valadao had raised $6.33 million and had $1.71 million in cash. Villegas had raised $5.94 million and had $962,352.
Rep. Robert Garcia faces Republican Brian Burley in California's 42nd District:
Garcia won the old 42nd in 2024 by 84,743 votes, the 2024 Statement of Vote shows. His current district had 34.1 points more registered Democrats than Republicans in October 2025, according to the 2025 registration report. The new 42nd, which takes in parts of Los Angeles and Orange counties, has 10.8 points more.
Garcia took 56.5% in June (114,942 votes), the only Democrat in the race, the Statement of Vote shows. Burley, a "Trustee, Huntington Beach City School District," took 20.6% (41,919), and Republicans Noah Von Blom and Long Pham took 16.8% and 4.9%. Republicans won 42.3% combined, a 14.2-point gap. The governor's race split 57.0% to 41.7%.
- Registration: 40.7% Democratic, 29.9% Republican, 21.6% no party preference.
- Money: Garcia had raised $3.39 million and had $1.57 million in cash. Burley had raised $251,137 and had $1,939.
Rep. Derek Tran faces Republican Chuong Vo in California's 45th District:
Tran won the old 45th in 2024 by 653 votes, 158,264 to 157,611, over Republican Rep. Michelle Steel, the 2024 Statement of Vote shows. Only the 13th was closer that year. The new 45th takes in parts of Los Angeles and Orange counties.
Tran was the only Democrat in June and took 53.8% (86,184 votes), according to the Statement of Vote. Five Republicans split the other 46.2%. Vo, a "Retired Police Officer," led them with 15.3% (24,591). The 7.5-point gap between the parties was the second-narrowest of any district in the House primary. In the governor's race, the district split 55.2% to 43.1%.
- Registration: 38.8% Democratic, 30.1% Republican, 25.3% no party preference. Tran's current district had 3.4 points more Democrats than Republicans in October 2025. The new 45th has 8.7.
- Money: Tran had raised $5.99 million and had $2.68 million in cash. Vo had raised $937,469 and had $175,456.
Rep. Dave Min faces Republican Jenny Rae Le Roux in California's 47th District:
Min won the old 47th in 2024, 181,721 votes to 171,554, over Republican Scott Baugh, the 2024 Statement of Vote shows. The new 47th lies entirely in Orange County.
Min took 45.4% in June (89,515 votes) and Le Roux, an "Entrepreneur/Investor," 25.0% (49,231), according to the Statement of Vote. Democrats won 54.0% combined and Republicans 42.9%, with a Libertarian and two no-party candidates taking the rest. The governor's race split 54.6% to 44.4%.
- Registration: 36.2% Democratic, 31.8% Republican, 25.6% no party preference. That 4.5-point gap is the narrowest of any California district. Min's current district had slightly more Republicans than Democrats in October 2025.
- Money: Min had raised $3.87 million and had $1.48 million in cash. Le Roux had raised $592,041 and had $135,774.
Republican Jim Desmond and Democrat Marni von Wilpert are running for the open 48th District:
Rep. Darrell Issa holds the current 48th and is not on the ballot; he did not run in the June primary, the Statement of Vote shows. Issa won in 2024 by 66,960 votes, the 2024 Statement of Vote shows. The new 48th takes in parts of Riverside and San Diego counties.
Twelve candidates ran in June. Desmond, a "San Diego County Supervisor," led with 38.9% (73,508 votes). Von Wilpert, a "Councilwoman/Health Advocate," was second with 20.8% (39,327). Nine Democrats split 53.3% of the vote and two Republicans 45.9%. That 7.4-point gap was the narrowest of any district with a Democrat and a Republican on the ballot. The 8.2-point gap in the governor's race, 53.4% to 45.2%, was also the narrowest.
- Registration: 37.1% Democratic, 31.9% Republican, 22.2% no party preference. Issa's current district had 12.0 points more Republicans than Democrats in October 2025.
- Money: Von Wilpert had raised $4.97 million and had $659,136 in cash. Desmond had raised $3.18 million and had $717,518.
Rep. Mike Levin faces Republican Armen Kurdian in California's 49th District:
Levin won the old 49th in 2024, 197,397 votes to 180,950, the 2024 Statement of Vote shows. The new 49th takes in parts of Orange and San Diego counties.
Levin took 55.9% in June (125,869 votes), the only Democrat in the race, according to the Statement of Vote. Kurdian, a "Retired Navy Captain," took 26.1% (58,822), and Republican Star Parker 18.0%. The governor's race split 54.6% to 44.3%.
- Registration: 36.7% Democratic, 31.5% Republican, 24.0% no party preference. Levin's current district had 1.8 points more Democrats than Republicans in October 2025. The new 49th has 5.2.
- Money: Levin had raised $3.56 million and had $1.36 million in cash. Kurdian had raised $189,196 and had $30,427.
Nine California House races are between two candidates of the same party:
Eight districts have two Democrats on the ballot and one has two Republicans. In each, the party that will hold the seat is already settled. The choice is between the candidates.
Reps. Ken Calvert and Young Kim are running against each other in California's 40th District:
Calvert represents the current 41st and Kim the current 40th, the House Clerk's member list shows. The new 40th takes in parts of Orange and Riverside counties. Calvert led the June primary with 75,811 votes (34.9%) to Kim's 44,818 (20.6%), according to the Statement of Vote.
Kim had raised $10.15 million through October 14, the third-most of any California House candidate, and had $910,973 in cash. Calvert had raised $7.05 million and had $980,391. Registered Republicans outnumber Democrats in the 40th, 39.5% to 31.3%, the October 19 registration report shows.
State Sen. Scott Wiener and Supervisor Connie Chan are running for San Francisco's 11th District:
Rep. Nancy Pelosi, who represents the current 11th, is not on the ballot. The new 11th lies entirely in San Francisco. Wiener, whose ballot designation is "State Senator," led a 12-candidate June field with 40.7% (95,816 votes), the Statement of Vote shows. Chan, a "San Francisco Supervisor," took 29.7% (69,899) and Democrat Saikat Chakrabarti 17.9%. Wiener had raised $5.81 million through October 14 and Chan $2.40 million.
The other seven same-party races, all between Democrats:
- 4th District: Rep. Mike Thompson (41.0% in June) faces Eric Jones (22.2%). Jones had raised $18.06 million, the most of any California House candidate, and $14.86 million of it came from Jones himself: $10.06 million in contributions and $4.8 million in loans, his FEC filings show.
- 7th District: Mai Vang, a "Teacher/City Councilmember," led Rep. Doris Matsui in June, 31.2% to 29.1%. Matsui's campaign had reported $7.84 million in receipts, including $5.4 million in loans from Matsui.
- 12th District: Rep. Lateefah Simon (84.2% in June) faces Jamie Joyce (15.6%).
- 14th District: Rep. Aisha Wahab (38.3% in June) and Melissa Hernandez (17.2%) meet again, in a rematch of the August 18 special election that Wahab won. Hernandez had raised $2.11 million to Wahab's $1.21 million.
- 29th District: Rep. Luz Rivas (51.0% in June) faces Angélica María Dueñas (24.9%).
- 34th District: Rep. Jimmy Gomez (46.0% in June) faces Angela Gonzales-Torres (30.7%).
- 37th District: Rep. Sydney Kamlager-Dove (55.2% in June) faces Samantha Mota (11.7%).
Four California House districts have no incumbent on the ballot:
Three members of the current delegation, Nancy Pelosi, Julia Brownley and Darrell Issa, did not run in June, the Statement of Vote shows. Rep. Linda Sánchez, who represents the current 38th, is running in the new 41st. That leaves four open seats:
- 11th District (San Francisco): Scott Wiener vs. Connie Chan, both Democrats (see above).
- 26th District (Los Angeles and Ventura counties): Democrat Jacqui Irwin, a "California State Assemblymember," took 41.3% in June, the Statement of Vote shows. Republican Sam Gallucci took 20.9%. Brownley represents the current 26th.
- 38th District (Los Angeles and Orange counties): Democrat Hilda Solis, a "County Supervisor," took 47.6% in June. Republican Pedro Antonio Casas, who has no FEC financial report on file, took 35.8%.
- 48th District (Riverside and San Diego counties): Jim Desmond vs. Marni von Wilpert (see above).
Four incumbents are running in a district with a different number than the one they represent now: Bera (6th to 3rd), Kiley (3rd to 6th), Sánchez (38th to 41st) and Calvert (41st to 40th).
California House candidates had raised $210.6 million through October 14:
The 104 finalists' campaign committees reported $210.6 million in total receipts for 2025–26 through October 14, by our sum of the FEC's candidate totals. That counts only the candidates' own committees. Spending by parties and outside groups is reported separately and is not included, and neither are contributions reported after October 14.
The five biggest fundraisers:
- Eric Jones (D, 4th): $18.06 million, $14.86 million of it his own money.
- Ro Khanna (D, 17th): $15.32 million. Khanna also had the most cash on hand of any House candidate on the ballot, $16.58 million.
- Young Kim (R, 40th): $10.15 million.
- Doris Matsui (D, 7th): $7.84 million, including $5.4 million in loans from Matsui.
- Ken Calvert (R, 40th): $7.05 million.
Four of the five are in same-party races. At the other end, five finalists show no receipts in the FEC's records: Robin Littau (2nd), Jeff Frese (10th), Charles Hoelter (15th), Pedro Antonio Casas (38th) and Ricardo Cabrera (51st).
California's House results start at 8 p.m. on November 3 and take weeks to finish:
Polls close at 8 p.m. on Tuesday, November 3. Counties begin reporting results then and must send totals to the Secretary of State at least every two hours until the election-night count is done, the key dates page says. Mail ballots postmarked by Election Day count if they reach the county by November 10. Voters have until November 25 to fix a missing or mismatched signature.
Close House races in California can take that long to settle. In 2024, the two closest, the 13th and the 45th, were decided by 187 and 653 votes. Counties must certify their results by December 3, and the Secretary of State certifies the statewide results on December 11. Our voting master guide explains how the count works and why it takes weeks.
The winners take office at noon on January 3, 2027, when the Twentieth Amendment to the U.S. Constitution starts each new House term.
California's 52 House seats after November 3:
Whoever wins on November 3, the Prop 50 map stays in place for the 2028 and 2030 House elections. The Citizens Redistricting Commission draws the next congressional lines in 2031, after the 2030 census, under the measure's text in the 2025 voter guide. After polls close, this guide will track the count in each district until the results are certified on December 11.
What to read next: How, when and where to vote in all 58 counties · All 24 statewide candidates · All 14 propositions · What, exactly, is Prop 50?
Status: This guide reflects the Secretary of State's certified list of candidates (August 27, 2026), the June 2 Statement of Vote, the October 19 report of registration, the House Clerk's member list (October 1) and FEC reports through October 14, 2026. Results begin at 8 p.m. Pacific time on November 3.
Sources & References
The information in this guide was sourced from:
- California Secretary of State, "Statement of Vote Summary Pages, November 4, 2025, Statewide Special Election" (PDF)—https://elections.cdn.sos.ca.gov/sov/2025-special/sov/06-sov-summary.pdf
- California Secretary of State, "Certified List of Candidates for the November 3, 2026, General Election" (PDF)—https://elections.cdn.sos.ca.gov/statewide-elections/2026-general/cert-list-candidates.pdf
- Office of the Clerk, U.S. House of Representatives, Member data, 119th Congress (XML, published October 1, 2026)—https://clerk.house.gov/xml/lists/MemberData.xml
- California Secretary of State, "Report of Registration, October 20, 2025" (15-day report, statewide special election)—https://www.sos.ca.gov/elections/report-registration/15-day-special-2025
- California Secretary of State, Registration by Congressional District, October 20, 2025 (XLSX)—https://elections.cdn.sos.ca.gov/ror/15day-special-2025/congressional.xlsx
- California Secretary of State, "Report of Registration, October 19, 2026" (15-day report, general election)—https://www.sos.ca.gov/elections/report-registration/15day-general-2026
- California Secretary of State, Registration by Congressional District, October 19, 2026 (XLSX)—https://elections.cdn.sos.ca.gov/ror/15day-gen-2026/congressional.xlsx
- California Secretary of State, "Official Voter Information Guide, Statewide Special Election, November 4, 2025" (PDF): Proposition 50 title and summary, Legislative Analyst's analysis and text of proposed law—https://vig.cdn.sos.ca.gov/2025/special/pdf/complete-vig.pdf
- Statewide Database, University of California, Berkeley, Proposition 50 and AB 604 map files—https://statewidedatabase.org/
- Office of the Governor, Special Election Proclamation, 1st Congressional District (PDF)—https://elections.cdn.sos.ca.gov/special-elections/2026-cd1/governors-proclamation.pdf
- California Secretary of State, "Congressional District 1, Special Primary Election, June 2, 2026: Final Official Election Results"—https://www.sos.ca.gov/elections/prior-elections/special-elections/2026-cd1/official-canvass
- Office of the Governor, Special Election Proclamation, 14th Congressional District (PDF)—https://elections.cdn.sos.ca.gov/special-elections/2026-cd14/governors-proclamation.pdf
- California Secretary of State, "Congressional District 14, Special General Election, August 18, 2026: Final Official Election Results"—https://www.sos.ca.gov/elections/prior-elections/special-elections/2026-cd14/official-canvass
- California Secretary of State, "Primary Elections in California"—https://www.sos.ca.gov/elections/primary-elections-california
- California Secretary of State, "Statement of Vote, June 2, 2026, Primary Election: Representative in Congress" (PDF and XLSX)—https://elections.cdn.sos.ca.gov/sov/2026-primary/sov/76-us-rep.pdf
- California Secretary of State, "Supplement to the Statement of Vote, June 2, 2026, Primary Election: Governor by Congressional District" (PDF and XLSX)—https://elections.cdn.sos.ca.gov/sov/2026-primary/ssov/gov-by-congress.pdf
- California Secretary of State, "Voter Participation Statistics by County, June 2, 2026, Primary Election" (PDF)—https://elections.cdn.sos.ca.gov/sov/2026-primary/sov/03-voter-participation-stats-by-county.pdf
- California Secretary of State, "Voter Participation Statistics by County, November 5, 2024, General Election" (PDF)—https://elections.cdn.sos.ca.gov/sov/2024-general/sov/03-voter-participation-stats-by-county.pdf
- California Secretary of State, "Statement of Vote, November 5, 2024, General Election: United States Representative" (PDF)—https://elections.cdn.sos.ca.gov/sov/2024-general/sov/25-us-rep-congress.pdf
- Federal Election Commission, Candidates for House, California, 2026 (financial totals through October 14, 2026)—https://www.fec.gov/data/candidates/house/?election_year=2026&state=CA
- California Secretary of State, "Key Dates and Deadlines, General Election - November 3, 2026"—https://www.sos.ca.gov/elections/upcoming-elections/general-election-november-3-2026/key-dates-deadlines
- National Archives, "The Constitution: Amendments 11-27" (Twentieth Amendment)—https://www.archives.gov/founding-docs/amendments-11-27


